


2024 MLB Outlier Data Points 3.0
Digging into outlier data points to spot potential buys and sells for fantasy baseball.

Welcome back to the Outliers series, where I go through some MLB data points that just don’t line up with expectations. That’s enough for the introduction, I’m going to just jump right into it.
Outlier #1: HR/FB Declines
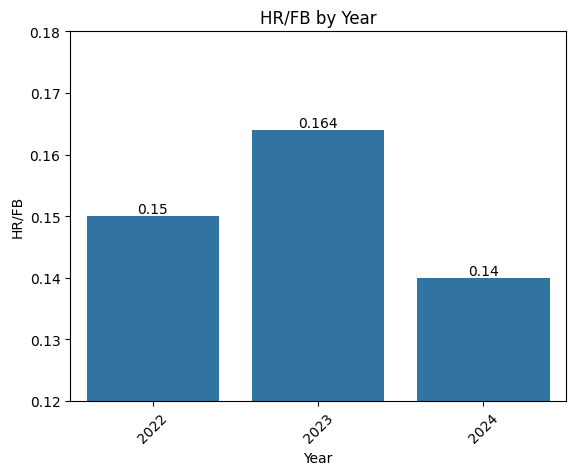
First of all, it’s worth noting that league HR/FB is down this year. This mostly has to do with the fact that a large share of the games played this year have been in colder weather since we’re still in May, but there might be some other stuff going on as well. There are trends elsewhere showing that 2024 offense appears down from 2023 even when controlling for weather factors.
We shouldn’t compare players to the league average if we have significant samples of their past. The player’s skills will make a big difference here, so for this analysis I compared each player’s 2024 HR/FB with what they did from 2022-2023. Your biggest decliners:
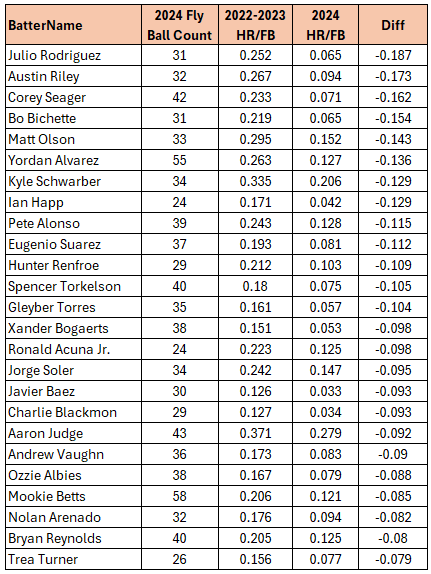
There are a handful of top-25 picks at the top of the list that have not been doing what their fantasy owners expected. The good news for guys like Julio Rodriguez, Austin Riley, Corey Seager, Bo Bichette, and Yordan Alvarez is that they are all well below projections in HR/FB, and this should even out as more time passes.
The three names stand out the most as players with huge differentials and really underwhelming home run counts so far. Taking a quick look at their pull rates (this matters a great deal in posting a high HR/FB)
Julio Rodriguez: 39.5% Pull% in 2023, 29% in 2024
Austin Riley: 39% Pull% in 2023, 34% in 2024
Corey Seager: 39% Pull% in 2023, 38% in 2024
Nothing to worry about there for Riley and Seager, but maybe the ten point drop in pull rate for J-Rod is a bit more concerning. I personally wouldn’t get too worried about it given the much larger, more dependable sample from 2022-2023 as compared to 2024, but there is more reason for concern there.
On the flip side of this, here are your biggest differentials going the other way:
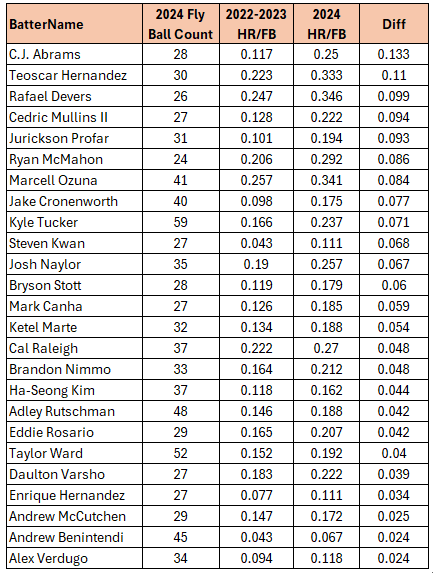
Not great news for C.J. Abrams who homered six times in his first 77 plate appearances and now has homered just once in his last 116. He has benefited from a high HR/FB at 25%, but some of that increase is backed up by the rise in Pull% from 36% to 48%.
Any time someone homers in six-straight games as Rafael Devers has done, you know there’s a bit of good fortune going their way. Devers pull rate is actually down three points from last season and yet here he sits with a crazy high 35% HR/FB. Things should slow down a bit for him on the power front moving forward.
Let’s look at the pitcher side of this before moving onto a different category. There is not nearly as much skill involved with pitchers here, all pitchers will tend to regress toward the mean as time goes by here. So we could just look at the lowest overall HR/FB this year:
Trevor Williams 2.9%
Reynaldo Lopez 3.0%
Tanner Houck 3.3%
Logan Webb 3.7%
Shota Imanaga 4.0%
It’s a very good bet that those rates will come up towards the league average (which I expect to be 15-16% this year) in the coming months.
On the flipside, the highest (“unluckiest”) rates:
Michael King 28.9%
Joe Musgrove 2.8%
Aaron Civale 25.0%
Dean Kremer 21.7%
Jared Jones 21.4%
Here are your 25 biggest drops from prior:
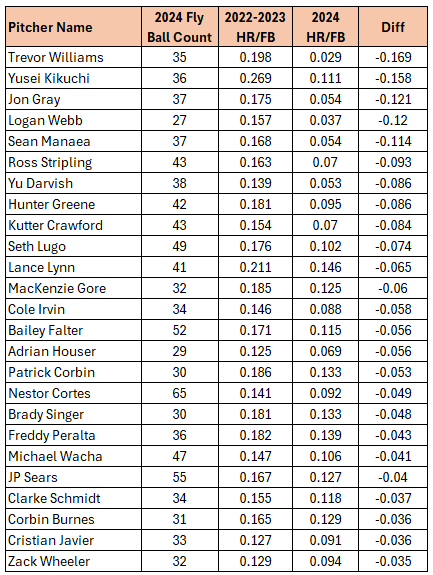
So we have plenty of luck going into the 2.35 ERA Trevor Williams is sporting. This is also a major, major shift from Yusei Kikuchi, who has had all kinds of trouble with the longball in his MLB career. But that is not the case this season as just four of his 36 fly balls allowed have flown over a fence. His 3.14 SIERA is still strong, but notably above the 2.60 ERA he has posted so far.
ERA - SIERA Differentials
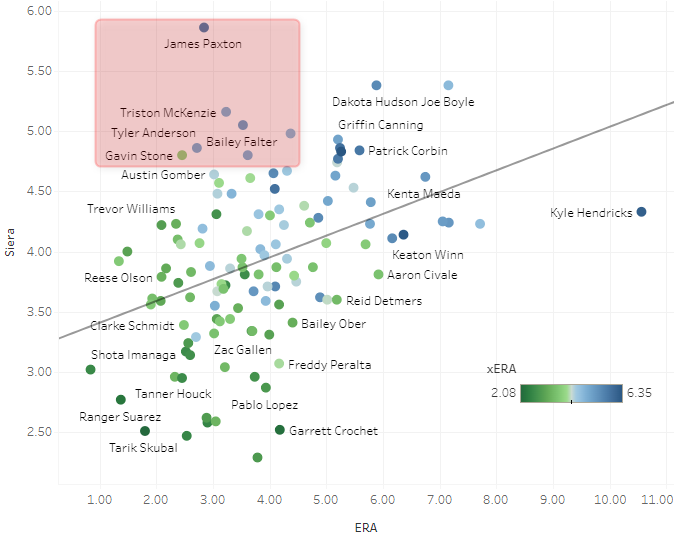
One of the easiest things to do to find over-performing or under-performing pitchers is do the quick ERA - SIERA differential. SIERA is a much better indicator of future ERA than current ERA is, so we want to have good knowledge of what these numbers are for fantasy-relevant pitchers. Here are the outliers shown in scatter plot form:
To put that in table form and show the pitchers with a SIERA at least two points worse than their ERA:
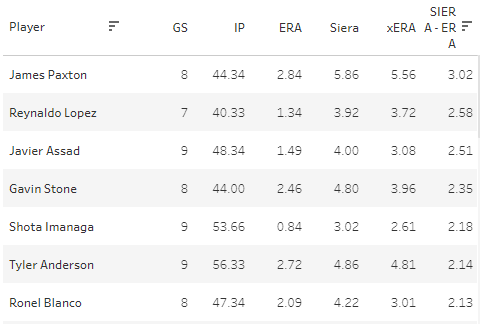
James Paxton looks completely cooked despite the 2.84 ERA he’s managed. He has as many walks as strikeouts this year (24 for a 13% K% and BB%), and he’s benefited from a .242 BABIP. There’s no redeeming marks under the hood either with an 8.6% SwStr% (10th-worst in the league) and 42.9% Strike% (9th-worst).
As for Reynaldo Lopez, things aren’t quite as bad. The K-BB% of 15.5% isn’t sparkling, but it’s a tick above the league average (14%). His 13.4% SwStr% is also a good sign. The reason for the differential has to do with what we saw above, he just hasn’t given up the long ball this year, and trust me - they’re coming.
Javier Assad has plenty of people’s head spinning, so we can take a look at his stats:
7.8% SwStr%, 46.9% Strike%, 36.2% Ball%, 22% K%, 7.7% BB%
That SwStr% is appalling to me, but shockingly the Strike% is about at the league average. That means he’s getting a bunch of called strikes and foul balls:
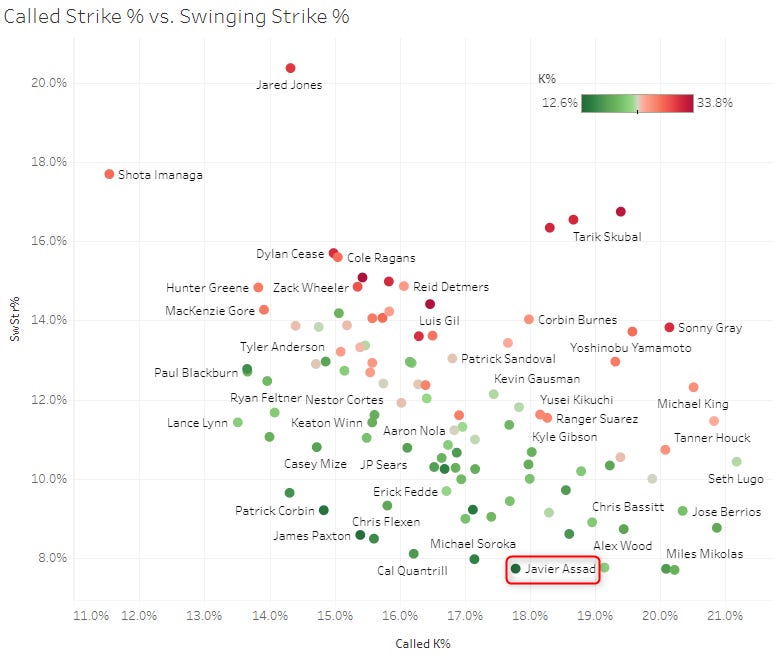
The BABIP is low at .248 and he’s given up just two homers on nine barrels and 37 fly balls, so there’s been plenty of good fortune for him. Maybe Assad has that extra special ability to fool hitters or put pitches right where they need to be, but I don’t really believe in any of that stuff so I would be running for the hills on Assad’s short term future.
Hitter BABIP
An oldie but a goodie. We know that BABIP is to some extent in the hitter’s control, but this early in the season you are still going to be seeing some wild numbers that just don’t line up with expectations.
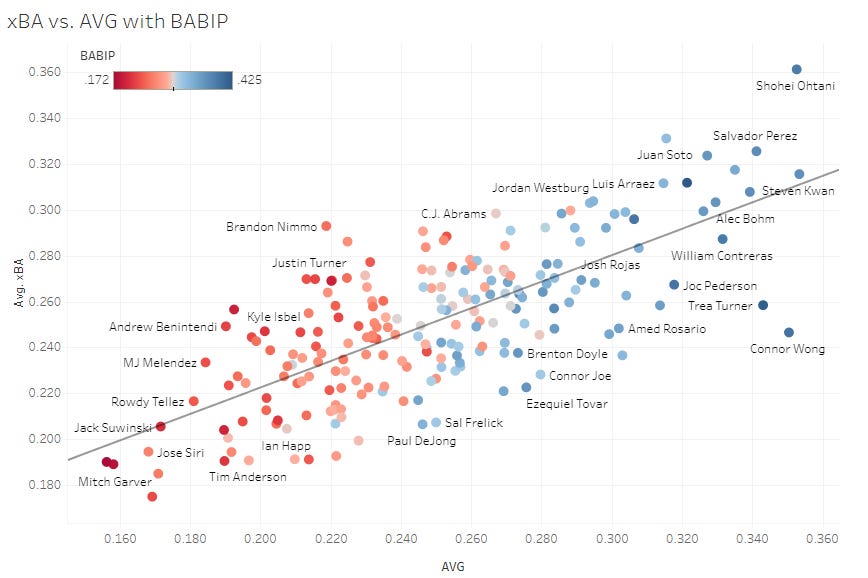
Connor Wong: Hitting a cool .350 on a .250 xBA and .400 BABIP.
Isaac Paredes: The guy is known to break some batted ball models, but a .303 batting average with his .237 xBA and .331 just isn’t going to stick around for long.
Brice Turang: Speed kills, and the strikeout rate is way down from the past, but a .357 BABIP and a batting average 60+ points above expectation suggests he’ll tick down towards .275 in a hurry, and that will slow down the steals pace.
LaMonte Wade Jr.: He’s not much of a fantasy asset, but it’s hard not to shout out his .425 BABIP.
Salvador Perez: If you just saw some of his numbers this year without the name, you would never guess it was Salvy. A 16% K% (24% last three years), a .374 BABIP (career .291), and a 7.4% BB% (career 3.7%). How often do you see a 34 year old catcher completely change their profile? I don’t know who Salvy will be from here on, but I know he’s not going to keep up a .374 BABIP for very long.
Others: Amed Rosario, Ezequiel Tovar, Connor Joe, William Contreras, Sal Frelick, Jose Altuve
The names on the other side of this:
Brandon Nimmo: The Mets really have taken some bad luck this year with two names at the top of the heap here. Nimmo is somehow hitting just .219 with a .293 xBA, but the .246 BABIP is bound to push upward, even if he is trying to hit more fly balls in these last couple of seasons.
Francisco Lindor: He is still trying to shake his way out of those early season numbers that buried him, and he’s yet to reach the mendoza line in batting average with his .193 mark. The xBA is a much better number way up at .257, and I have trouble believing his BABIP will be below .200 (.195 currently) for more than even the next two weeks or so.
Christopher Morel: He has dropped the strikeout rate from 31% to 21%, and yet he’s posting the lowest batting average of his career at .216. He hits the ball very hard and runs pretty fast, so you should really be surprised by the .221 BABIP here. There are better times ahead for Morel, and with the nine homers and four steals he’s posted early on, he’s already been a pretty useful fantasy player even with the bad luck.
Others: MJ Melendez, George Springer, Xander Bogaerts, Andrew Benintendi, Vinnie Pasquantino
And there you have it - the third edition of the Outliers series. I’m happy to take your ideas if you have thoughts about other potential outlier statistical categories. Thanks for reading!