


Air Pull Analysis
A look into what we can learn from the "air pull" stat. Which players are excelling here, who has improved the most from last year, and other stuff.


There’s some talk going around about air pull rates, and for good reason. We know that the easiest way to hit a home run is to pull a fly ball. Let’s get started with some league-wide home run rates by batted ball classification.
→ 4.2% of all batted balls are homers
→ 14.5% of all fly balls are homers
→ 17.6% of all air pulls are homers
→ 43.1% of barrels are homers
→ 65.4% of pulled barrels are homers
If we just look at fly balls and break them down into the three directions you can hit them.
→ 37.3% of pulled fly balls are homers
→ 9.2% of fly balls to center are homers
→ 4.6% of fly balls to the opposite field are homers
You can see the huge advantage of pulling a fly ball as compared to hitting it to center or the opposite way. There are a lot of physical reasons for that, but we don’t have to get into it now.
But since Air Pull Rates are the topic of the day, let’s focus in on that. The way Baseball Savant has defined an Air Pull is any ball that isn’t a ground ball that is pulled. I have no idea why they’d include popups in that. Popups have a 0% chance of going for a (real) home run. So, in my calculation, I’ve removed them.
So your air pull rate is the percentage of total batted balls that are a pulled line drive or pulled fly ball.
As you have probably already heard, Cal Raleigh is the king this year. You can find this stat on the “BB Profile” of the main MLB dashboard.
Here’s the top 12. It’s everybody above 24% by the way I calculate it.

This would usually be Isaac Paredes’ cake to eat, but Raleigh has bested in it so far. Paredes’ ability to pull a fly ball is the only reason he has a Major League job, and he’s probably an All Star level player this year now that he’s ended up in the perfect ballpark for his profile.
It’s all the more impressive that Raleigh is doing this as a switch hitter.

Let’s keep moving down the dashboard. Here’s 15 more, all above 22% (the league average is 15.2%).

Let’s go down to show everybody over at least 20%.

You find some interesting names here. It’s encouraging from a fantasy baseball perspective to see someone like Jose Caballero here. The guy makes his fantasy value almost exclusively from stealing a ton of bases. But if he’s goiing to be pulling a bunch of fly balls, he could also end up with 8-12 homers along the way, which would be a big increase in the fantasy value.
Some other interesting names here.
Andrew Benintendi. We have talked in the daily notes a few times about Benny’s change in approach. Late last year, it seems he just decided to start hitting dingers and not caring about much else.
From 2023 through July 2024: 952 PA, 13 HR
From August 1, 2024 to today: 360 PA, 18 HR
Rhys Hoskins: Much has been made of Hoskins’ resurgence in 2025. After missing the full 2023 season, he slugged just .416 in 2024 but still managed 26 homers. This year, he’s raised the SLG to .443 and dropped his strikeout rate almost four points, and he’s been a much better player (OBP up to .360 this year).
Ramon Laureano: He keeps hanging around the league, and now he’s caught on with the Orioles. He’s been mostly a weak-side platoon bat, but he’s handled the bat well in his 117 PAs this year with a .264/.316/.528 slash line and seven homers. He is a deep league and a DFS target in favorable matchups.
Let’s check the biggest improvements from 2024 to 2025. Here is everybody who qualified last year and who has at least 75 batted balls this year with an improvement of at least six points.

Really good to see Alex Bregman getting back to this. He is not a guy who swings the bat very hard, so he relies on the pulled fly ball and backspin to rack up his homers. And he’s been great when on the field for the Red Sox this year with a .553 SLG. I’m doubting it will stay that high all year, but it’s safe to say he’ll stay well above the ~.450 mark he posted between 2023 and 2024.
The batted ball profile has also been key for Spencer Torkelson in this re-entry he’s having. The Tigers are humming right along, and they owe Tork a lot of thanks for them. He’s hitting just .237, but the power production is back with a .500 SLG and 15 homers already. He’s on his way to a 25-30 homer season, and the Tigers offense needed that badly from a right handed bat.
We should point out that Pete Crow-Armstrong is excelling here. He’s added bat speed and raw pop this year, but he’ll never be a guy spraying dingers to all fields. He’s probably the most-improved hitter in the league this year. So big hat tip to him for the work he put in this offseason. Very impressive stuff for PCA.
Here’s a searchable/filterable table if you’re looking for something in particular:
And here’s a scatter plot that will show us something about the air pull rates along with how hard each guy is hitting the ball.
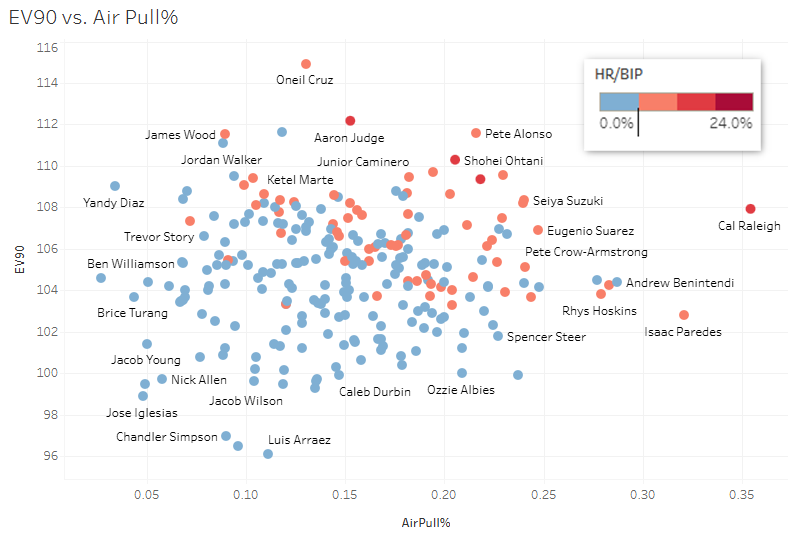
Here’s a link to the interactive plot.
The guys closest to the top-right of the plot are the best results. There aren’t many surprises in that area. But guys like Ben Rice, Kyle Stowers, and Addison Barger are among those dots - and that gives more vlaidation to the breakout seasons they’re having in 2025.
This post would not be complete without me telling you which players are over-performing and under-performing in home run production based on what we’ve talked about here.
But I’ll add one thing onto it first. Let’s filter to only hard hit air pulls. We’ll compare that rate with home run rates and see which hitters don’t line up.
The lowest HR% for hitters above average in hard hit air pulls:
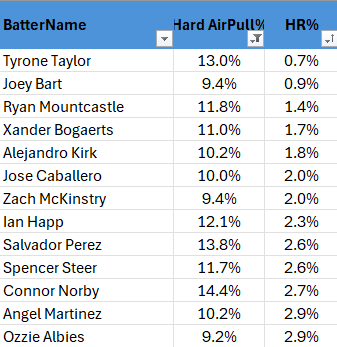
These guys are probably due for some more homers.
The flip side of it:

It does make sense to see someone like James Wood at the top here. That guy has opposite field power that you don’t see very often.
That seems to be the common denominator with that list. Those are mostly guys with huge raw power that can pile up homers even if they aren’t pulling the ball. But you’d still like them to pull the ball a bit more.
The guys on the list to be ab it more concerned about would be Yelich, Crews, Flores, and O’Hearn. They’ve all been a bit fortunate to have as many homers as they do, I think.
And that’ll do it for this piece. Paid subs have access to the main dashboard where they can track this stat all year. You can even filter by date range and pitcher handedness and stuff.

Goodbye, for now!