Examining Batted Ball Data to Find Impending Power Breakouts
No time for fancy talk today we’ve gotta drill into some numbers and then I’ve gotta go swimming with my kids.
Where Does a Home Run Come From?
Some quick stats on 2024 home runs hit in Major League Baseball.
91.8% of homers have been fly balls
85.6% of homers have been barrels
62.4% of homers have been pulled
Your best chance at finding a fence for the ball to fly over is to hit a ball hard, in the air, and to the pull side. I’m not telling you anything you don’t know.
Who Is Best at Pulling Barrels?
These numbers might not match exactly other sources because my pull% calculation is slightly different than other sources. The number you see below is pulled barrels divided by plate appearances.
Oneil Cruz 5.79%
Brent Rooker 5.76%
Aaron Judge 5.61%
Christian Walker 5.50%
Giancarlo Stanton 5.32%
Jose Ramirez 5.23%
Jake Bauers 5.17%
Marcell Ozuna 5.08%
Kyle Tucker 4.98%
Corey Seager 5.96%
Rhys Hoskins 4.85%
MJ Melendez 4.67%
Juan Soto 4.67%
Anthony Santander 4.63%
Tyler O’Neill 4.48%
Francisco Lindor 4.39%
Joc Pederson 4.37%
Salvador Perez 4.32%
Wilyer Abreu 4.23%
Matt Vierling 4.15%
Shohei Ohtani 4.05 %
Adam Duvall 4.02%
Adley Rutschman 4.01%
Cody Bellinger 3.92%
Lourdes Gurriel 3.90%
Now, let’s filter out the names on there that are already hitting a bunch of home runs. For example, I don’t want to use more than one sentence on this page of the Internet to tell you that Aaron Judge is going to hit a bunch of home runs going forward. You know that, he’s hit a homer in 8.1% of his plate appearances and something close to that will continue. Some of the players that have done a lot of barrel-pulling without the same rate of balls finding the seats.
Oneil Cruz
He leads the league in this statistic, at least by the specific calculation I have, and yet he has just nine homers and a low 3.47% HR/PA. And we can’t blame his strikeout problem here because we’re counting those in the denominator here since we’re using plate appearances rather than balls in play.
The thing that is different about Cruz is that he hits the ball so hard that a lot of his line drives count as barrels. Only 24% of barrels are labeled as line drives. He has 29 barrels and 20 of them have been line drives, that number leads the league.
Line Drive Barrels Leaders
Oneil Cruz 20
Aaron Judge 17
Pete Alonso 14
Vlad Guerrero Jr. 13
Tatis/Ohtani/Stanton 12
It doesn’t matter how hard you hit the ball, if it comes off the bat at 12 degrees it won’t make it over the fence. He’s hit 15 barrels under 20 degrees and just one has gone for a homer.
So he will probably continue this kind of thing where his barrel rate doesn’t match his home run rate, but the other point is that a 25 degree launch angle is not a far from a 15 degree launch angle, so if some of these balls start coming off the bat just a millimeter (or whatever it would be) higher on the bat, we’re in for a barrage of homers even with the high strikeout rate. At some point, this dude is going to hit a ball at 120 and 25 degrees and it’s going to be fun to see how far it flies.
With all of that considered, it seems pretty clear that Oneil Cruz’s home run pace should speed up.
Jake Bauers
Just real quick here because Bauers is a part-time player at best. He strikes out a ton, but when he’s putting the bat on the ball it is loud contact a lot of the time. He’s pulled nine barrels this year for a nice 5.17% rate in what we’re looking at here, and yet he has just six homers to show for it. This is not a fantasy option right now, but if he were to get forced into more playing time - he could be a good deep league add for some cheap pop.
MJ Melendez
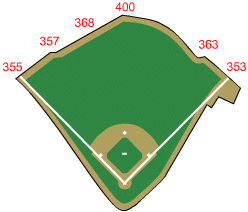
This is where park factors enter the picture. Kauffman Stadium has long been a park that suppresses homers, and that’s probably a lot of what’s going on here with Melendez.
Pulled Barrels: 10
Homers: 8
Pulled Barrel / PA: 4.67%
HR/PA: 3.74%
Melendez would have a dozen homers if he played all of his games in Cincinnati, and most other parks would have earned him 9-10, but here he has just eight.
It’s fair to say that Melendez is due for some better results on contact (the .193 BABIP certainly won’t continue for long), but given his game, but he’s unlikely to be a guy you want in 12-team leagues any time soon.
Francisco Lindor
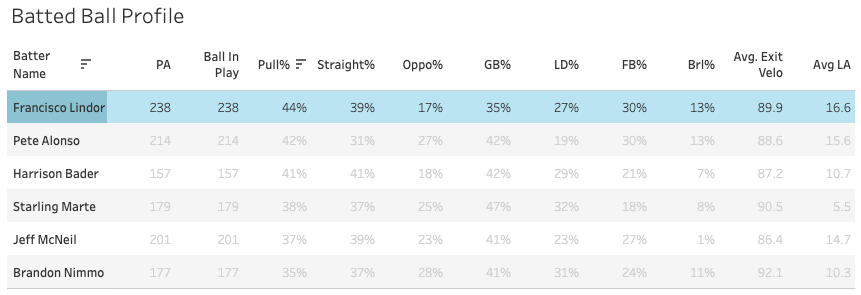
He has really turned it around after a slow start to the year that was driven by bad luck, but he shows up here with his nice 5.39% PulledBrl/PA but a much lower 3.76% HR/PA. That PulledBrl/PA is in the 95th percentile, but his home run rate is in the 79th percentile - a pretty big gap there.
His 44% Pull% is strong, although on fly balls it does drop to 21%. But when he gets the ball in the air, he impact it well with an average exit velocity of 94mph).
Ian Happ
He’s really turning it on lately and he’s gotten himself to 10 pulled barrels and a big .918 OPS over the last month, but the homers still haven’t come as much as maybe they should. Wrigley Field does have that really deep fence in deep left field, and Happ has had his share of fly outs over there in his career, but I’m not sure that’s the full explanation here.
Happ has a solid 3.56% PulledBrl/PA rate here but just a 2.85% HR/PA. That’s the biggest percentile differential in the league (86th percentile vs. 57th percentile).
Bryan Reynolds
Exit velocity does factor in here as well. Reynolds is a guy that hits a lot of balls in the optimal launch angle range, but often times they aren’t hit as hard as you would like because he’s far from the highest bat speed guy in the league. His teammate Oneil Cruz is averaging 112mph on his barrels, and Reynolds is down at 104. But compared to the league average (105), Reynolds is right about there.
So it’s fair to say Reynolds should speed up the homer pace a bit, he has just nine this year despite having hit 21 barrels and pulling 10 of them.
That’s it, I ended up rushing this a little more than maybe I should have, so don’t judge my work on this post. The good news is it’s free and not completely useless. Deuces!


