Hitter Motivation: Do Hitters Perform Worse On Bad Teams?
Checking the history of hitters on very bad teams at the end of the year to see if they tend to perform worse due to a lack of motivation.
The coding part of this took a lot longer than the writing part will take, It does feel a little weird when an hour of coding goes into something that will only take you 90 seconds to read, but I suppose that’s the best way to deliver information. Strong data analysis, simple and quick summarization.
What’s The Point
I am trying to figure out the answer to this question:
Do hitters on really bad teams perform worse late in the year due to a lack of motivation?
It is August 7th, 2024, right now. The Chicago White Sox have already lost 88 games. Maybe you have Luis Robert on your fantasy team, and you are wondering if he’s ready to just shut it down at the plate this year and get to the offseason.
That’s a fair question. I think we all can imagine how tough it would be to give your full effort in your sixth month of a long baseball season when the games haven’t seemed to matter much for several months.
How Do We Check?
There are plenty of ways to do this, but I wanted to keep it as simple as possible. So what I am looking for are:
Teams who won 65 or fewer games in a season between 2000 and 2023
And then I take each of those teams and do this:
Find the wRC+ and wOBA for each hitter that had enough plate appearances in September-October to qualify
Compare those two numbers with what they did for their full season that year
And then we use those two lists of numbers to see if players on average perform worse in that last month of games where there team is drawing completely dead.
What’s My Guess
I don’t think we’ll find any drop-off in performance late in the season, but I legitimately do not know the answer yet as I’m writing this.
Teams Studied
2023: OAK, COL
2022: OAK, CIN, PIT
2021: BAL, ARI, TEX, PIT
2019: DET, BAL, MIA
2018: BAL, MIA, DET
2017: DET
2016: MIN
2015: PHI, CIN
2014: ARI
2013: HOU, MIA
2012: HOU, CHC, COL
2011: HOU, MIN
2010: PIT, SEA, ARI
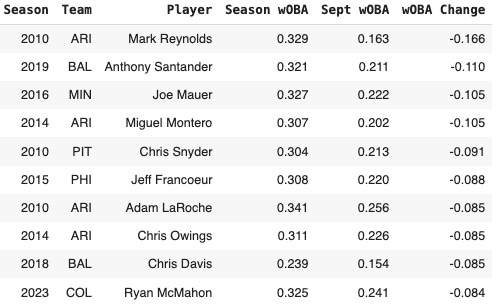
I could just give you the answer right away, but first, let’s take a trip down memory lane. The biggest decreases in the data:
Anybody can just randomly have a very bad month, we cannot infer causation from the correlation here. So just keep that in mind, no individual data point here proves anything. It’s the bigger picture we’re looking at.
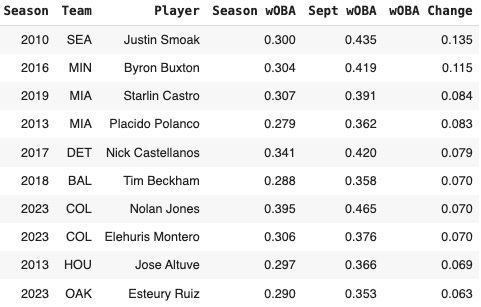
The guys who did their best even with their teams sputtering to the finish line:
More things to keep in mind: there are plenty of reasons why a player would want to perform well even despite how their team is doing. A lot of guys are trying to stay in the league or playing for a new contract. Money turns out to be the best motivator, and unless you’re a veteran player who has already landed his last contract, money is going to be on your mind.
That’s the main reason that I hypothesized that we wouldn’t see a change.
The Result
wOBA
Average wOBA Change: -.007
Average wOBA % Change: -2.3%
So yes, they did perform slightly worse in that final month. Seven points of wOBA right now in 2024 is the same as the difference between Bobby Witt Jr. and Brent Rooker, not a very big difference.
As for percentages:
53.3% of hitters performed worse in Sept-Oct
45.0% of hitters performed better in Sept-Oct
1.7% of hitters posted the exact same wOBA
wRC+
Average wRC+ Change: -4.8
Average wRC+ % Change: -5.3%
54.4% of hitters performed worse in Sept-Oct
45.6% of hitters performed better in Sept-Oct
So we have our answer. Expect hitters on these very bad teams to perform just slightly worse than before down the stretch, but not so bad to the point where you’d want to move them off of your fantasy at any cost. A 4-6% drop in performance doesn’t move them down the fantasy ranks more than a couple of spots.
For The Coding Bros
How I got my data.
Scrape the Standings:
Get Stats:
Two different URLs for that where you can get the data from the FanGraphs API.
Full Season:
https://www.fangraphs.com/api/leaders/major-league/data?age=&pos=all&stats=bat&lg=all&qual=1&season={}&season1={}&startdate=&enddate=&month=0&hand=&team=0&pageitems=2000000000&pagenum=1&ind=0&rost=0&players=&type=1&postseason=&sortdir=default&sortstat=wRC%2B'.format(year,year)
September-October Splits:
https://www.fangraphs.com/api/leaders/major-league/data?age=&pos=all&stats=bat&lg=all&qual=1&season={}&season1={}&startdate={}-03-01&enddate={}-11-01&month=9&hand=&team=0&pageitems=2000000000&pagenum=1&ind=0&rost=0&players=&type=1&postseason=&sortdir=default&sortstat=wRC%2B'.format(year,year,year,year)
That returns JSON which you can scrape like this:
There are a ton more stats available in there, I just picked wOBA and wRC+ for simplicity since they encompass player performance pretty well all by themselves.


