How Sticky is Sweet Spot Rate?
A look at the sweet spot rates. What is it? How sticky is it? Which hitters are set for regression in 2025?
What Is Sweet Spot Rate?
It’s very simple. A “sweet spot” ball in play is one hit between 8 and 32 degrees.
It’s good to hit balls in this range.
AVG & SLG by Sweet Spot Yes/No
YES: .570 AVG, 1.017 SLG
NO: .186 AVG, .252 SLG
What’s It Look Like?
The distribution from 2024:
Minimum: 23.1% (Johan Rojas)
25th Percentile: 32.3%
50th Percentile: 35.0%
75th Percentile: 37.8%
Maximum: 47.8% (Connor Norby)
Here’s what the histogram looks like for the league leader, Connor Norby:
And here’s the histogram for the league’s worst hitter in this regard, Johan Rojas:
Is It Sticky?
The question of stickiness is: how well can we predict what will happen next year in a stat if we know what happened this year in the same stat.
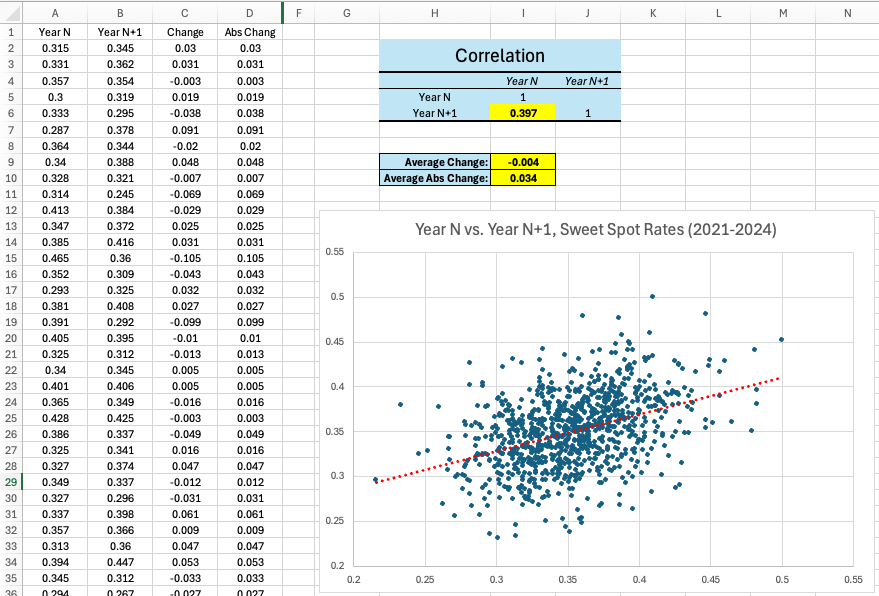
So I looked at the numbers going back to 2021. I found every hitter with at least 100 balls in play every season. I found every hitter who had 100+ balls in play in two consecutive seasons, and then put those numbers in a list next to each other.
The Excel file looked like this:
After I had a bunch of numbers (925 in each list), it’s easy to do the correlation and some plotting. The correlation coefficient was 0.397.
The average change was -.4%, less than half of a point. Looking at the average absolute value change, we see a 3.4-point average change (ignoring which direction it went). The biggest change was 14.6 points.
That 0.397 coefficient shows a pretty weak relationship. That means there will be a regression to the mean. 104 times in this sample, a hitter went above a 40% Sweet Spot. Only 11 of those (10.6%) went up the next year. And the reverse is true.
Takeaways
We have set ourselves up for some simple lessons to be learned. Any hitter who benefited from a very high sweet spot rate one year is likely to regress the next year, because there is a lot of randomness in this stat. Here are your top 20 Sweet Spot Rates from 2024:
Connor Norby 47.8%
Daniel Schneemann 44.4%
Logan O’Hoppe 44.2%
Brandon Marsh 44.1%
Freddie Freeman 44.0%
Nolan Gorman 44.0%
Taylor Ward 43.5%
Leo Jimenez 43.1%
Lenyn Sosa 43.0%
Luis Arraez 42.9%
Chris Taylor 42.9%
J.D. Martinez 42.4%
Gavin Sheets 42.2%
Kerry Carpenter 42.2%
Austin Martin 42%
Ramon Laureano 41.9%
Eugenio Suarez 41.9%
Brandon Lowe 41.8%
Andy Pages 41.8%
Aaron Judge 41.8%
I used 100 balls in play minimum there, which was a low number. If we look at hitters who played close to a full season (400+ BIP):
Freddie Freeman 44.0%
Taylor Ward 43.5%
Luis Arraez 42.9%
Eugenio Suarez 41.9%
Marcell Ozuna 41.6%
Jackson Merrill 41.6%
Steven Kwan 40.8%
Jonathan India 40.5%
Nick Castellanos 40.5%
Ezequiel Tovar 40.5%
Willi Castro 39.7%
Salvador Perez 39.6%
Shohei Ohtani 39.5%
Gleyber Torres 38.8%
Bryan Reynolds 38.8%
Willy Adames 38.4%
Brenton Doyle 38.4%
Brendan Donovan 38.4%
Nolan Schanuel 38.3%
JJ Bleday 37.9%
Maybe we aren’t giving guys like Freeman and Arraez enough credit. There are some guys who make careers on this kind of stuff, and that seems to be the case with those two names. If we look at their data:
Not a single season below 39%, so you can count on those high rates to continue for those names. Some other players that have above 38% at least three of the last four years:
Aaron Judge
Luis Arraez
Brandon Marsh
Adam Frazier
Chris Taylor
Andrew Benintendi
J.D. Martinez
Justin Turner
Freddie Freeman
Zach McKinstry
Dominic Smith
Bryan De La Cruz
Omar Narvaez
Bryce Harper
Josh Lowe
Whit Merrifield
Gleyber Torres
Jeimer Candelario
Rob Refsnyder
Corey Seager
Brent Rooker
Harold Castro
Donovan Solano
Tomas Nido
Taylor Ward
Eugenio Suarez
Will Smith
Nolan Gorman
Austin Slater
Brandon Belt
Kyle Higashioka
Nick Castellanos
Anyway, I’ve made my point. Be wary of a hitter with a very high Sweet Spot% that hasn’t proven to be able to continue that year in and year out.
On the flip side, some players with very low Sweet Spot Rates in 2024 who will likely regress positively next year:
Kyle Isbel 26.8%
Christopher Morel 28.1%
Joey Ortiz 28.3%
Corbin Carroll 28.7%
Hunter Renfroe 28.8%
Yandy Diaz 28.8%
Jacob Young 29.2%
Randy Arozarena 29.7%
William Contreras 30.1%
Jesse Winker 30.1%
Jeremy Pena 30.2%
Josh Naylor 30.5%
George Springer 30.6%
Zach Neto 30.7%
Orlando Arcia 30.9%
Sal Frelick 31.0%
Jonah Heim 31.3%
Rhys Hoskins 31.4%
Nicky Lopez 31.5%
Daulton Varsho 31.5%
You can access the full data here.
Some names that declined majorly from 2023 to 2024 (these players may be more likely to improve in 2025 since they have a higher season in the recent past):
Alex Kirilloff (42.6% → 28.7%)
Sean Murphy (39.6% → 26.3%)
Anthony Rizzo (43.0% → 31.4%)
MJ Melendez (37.3% → 30.1%)
Brett Baty (35.4% → 28.6%)
Bo Bichette (39.6% → 32.9%)
Vinnie Pasquantino (38.8% → 32.3%)
Jack Suwinski (35.6% → 29.4%)
Josh Naylor (36.6% → 30.5%)
Alrighty, there you have it, another offseason analysis post. I wasn’t even planning this one, I just did it because I was writing up the Marlins and noticed how high Connor Norby’s number was there. I’ll reference this in the Marlins 2025 Preview, and will link to it in the Resource Glossary so you can come back to it later if you need.


This is a repeatable skill for the top end and low end. Highly correlated with bat & attack angle optimization. All the "launch angle revolution" guys are at the top for a reason.