HR/FB Analysis
How does HR/FB work? What are the expectations and correlated inputs? Which hitters are under-performing in 2023, and which hitters are over-performing?
We like home runs! No matter what league or game you play, you want hitters hitting the long ball.
I’m here to talk about the HR/FB stat often cited when talking about which hitters are under or over-performing in homers. I’m going to rip through some stuff here. Let’s set up the post with some data on the home runs hit in the Major Leagues in 2023.
Velocity & Angles
Here’s the distribution data on tracked homers this year (there’s a handful that Statcast didn’t capture data on)
Here’s some Python code you can use on the Baseball Savant data set to generate the same stuff I’m talking about
sav23[‘IsHomer’] = np.where(sav23[‘events’]==’home_run’,1,0)
hrs = sav23[(sav23['IsHomer']==1)&(sav23['launch_speed']>0)]
hrs = hrs[~(hrs['des'].str.contains('inside'))]
print(hrs['launch_speed'].describe())
hrs['launch_speed'].hist(bins=20, color='maroon')
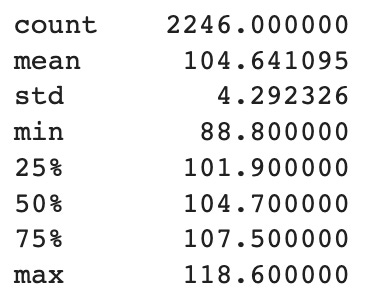
That’ll give you this output for the distribution description:
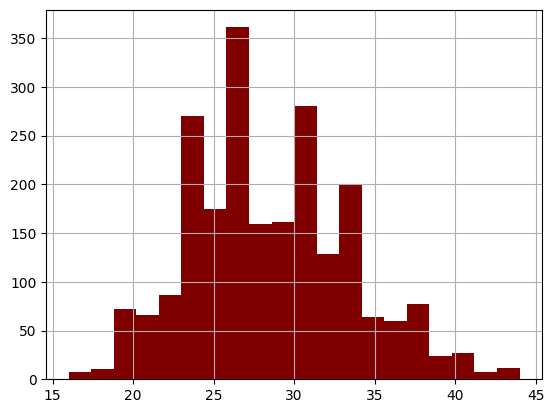
… and here’s that histogram:
So the average home run is hit right below 105 miles per hour the max this year is 118.6, and the minimum (I took out the inside-the-park jobs) is 88.8.
Here’s the softest-hit homer of the year:
Here’s your hardest-hit homer:
As for the launch angle:
It’s a pretty wide range here, but mostly between 20 and 35 degrees. Your highest-hit homer of the year is 44 degrees, and that’s happened a few times, but here’s the softest-hit homer at that angle.
Fly Balls
90.9% of home runs are classified as fly balls based on their EV and LA. So almost all home runs are fly balls, but only 15.6% (to this point in the season) of fly balls are home runs.
That 15.6% mean is not really one that we should always expect hitters to regress toward. There are two main ways hitters can turn more of their fly balls into homers
→ Hit the fly ball very hard
→ Pull the fly ball
I think that there’s something to the contact point of a pulled ball that generates more exit velocity, maybe that point is when the bat is near its max speed or something like that - but another key point is that usually, the fence is closer to you down the lines than in centerfield, so pulling (or pushing) would give you more room for error.
Right now, Aaron Judge and Jake Burger lead the league in HR/FB at a very high 40%. Stats on these two:
Judge: 101.6 average FB EV, 29% Pull%
Burger: 97.5 average FB EV, 47% Pull%
League: 92.2 average FB EV, 23% Pull%
So both guys are way above the league in EV and both above in pulling the ball as well. Note that my pull rate numbers aren’t going to match Statcast, because I don’t know their exact formula for spray angle and stuff, so I had to kind of create my own, but at the very least it should be good at finding which hitters pull more or less.
Plotting & Data
Here’s a scatter plot to visualize all of this. You can see FB Velo on the y-axis, HR/FB on the x-axis, and the color of the dots represents the pull rate.
Regression Model
Any time we have multiple inputs trying to predict an output, we can use correlations and then a linear regression model to compare expectations vs. actuals. First, the correlations here:
That’s straight from Excel, the data can be found here.
To replicate that, you have to install the data analysis tool pack in Excel and then use the “correlation” option inside of that. If you’re really interested in learning how to do that and can’t figure it out yourself, reach out!
Now we’ll set up a linear regression model:
That gives us these results:
The R Square value here of .61 shows us that you can decently explain HR/FB with FB Velo and Pull rate, but there’s still plenty of variance there that is not explained by these. We’re not going to get anywhere near perfect with this. If we were doing this for real we would also want to consider ballpark and maybe even pitch quality faced, but this works for our purposes.
At the bottom of the screenshot, you see the “Coefficients”. That means we can build a prediction model with this calculation
xHR/FB = -1.59 + (FB VELO * 0.186) + (Pull% * .2)
Now we have that set up, and we can look for the biggest differentials. I didn’t really intend to turn this into an Excel lesson, but maybe somebody out there will appreciate it. Teaching Excel and Python might be just future career path, so this is a good start.
Biggest Over-Performers
I found 14 hitters with differentials smaller than 8 percentage points, here they are:
The biggest over-performer, according to this rough study, is Francisco Alvarez. His pull rate is high, but his average exit velocity on fly balls is barely above average and that just doesn’t make a lot of sense with the extraordinarily high 36.4% HR/FB.
Brian Anderson is not pulling the ball or hitting it hard and yet has still exceeded the league average HR/FB by a good distance at 22.9%, so that’s pretty lucky for him even in the good hitters’ ballpark.
The one thing you notice here though, which gives us immediate pause, is that four of these names are Rays. Now, I thought that this would control for the things that would have a certain team overperforming. You could do this by getting your hands on a bunch of high-EV players and just having your team take the pull approach, but it would seem likely that there’s something else going on that the Rays have caught on to.
They are third in the league as a team above a 20% HR/FB. Is it the ballpark? Tropicana isn’t really known as a hitter’s park. Let’s check road hitter’s HR/FB in each park:
Okay, so there must be something to the Trop after all, even road hitters are seeing a high HR/FB at 18.3%. We’re dealing with a decently small sample size here, but if we include 2022 data, Tampa is still in the top five:
So I guess we can expect the Rays to over-perform a bit just because of the ballpark, but I still think there might be something else going just with how the Rays are seemingly able to hack player performance. Anyways, there are your top over-performers above.
Biggest Under-Performers
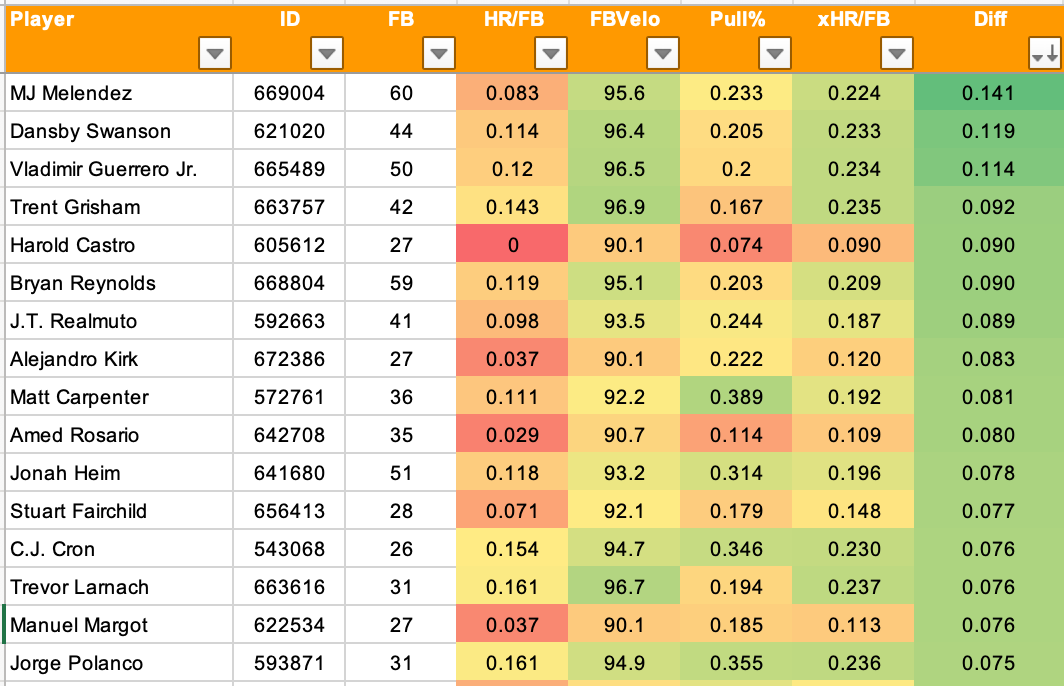
Sixteen hitters have expected marks 7.5 points or more under their actual:
Melendez has had an unlucky year. He’s still hitting the ball hard and pulling it around league average but has come up with just five homers on his 60 fly balls. Kauffman Stadium is a huge culprit here. That stadium is in the bottom 10 in HR/FB allowed over the last two years, and it routinely ranks in the bottom three in terms of something more stable like HR/Brl.
HR/Brl Extreme Parks :: 2022-2023
CLE 26%
PIT 35%
STL 37%
KC 38%
TOR 39%
~~~
League average: 48%
~~~
NYM 55%
LAA 59%
CWS 59%
DET 62%
LAD 62%
Vladimir Guerrero Jr. and Dansby Swanson are the next two least fortunate here, and they both are near the bottom of the list in HR/Brl as well, which confirms that they’ve had some bad luck. It really stinks for this to happen if you’re the Vlad Guerrero Jr. owner. You probably have just gotten past the fact that he’s going to continue to be a ground-ball hitter, but now you have to deal with bad luck on the fly balls he does hit.
I would expect regression toward the mean for everybody at the top and bottom of the list, so it’s good news for these guys and bad news for the guys in the last section.
I don’t really feel the need to spend any more time on individual players. The one thing I want to do more with this blog is just provide data and Python code & Excel tips and whatnot, and then let everybody else go and do the rest - because to me, that’s the most fun part about all of this!
Take the plots, take the data, and go forward! Best of luck to you all, thanks for being here!


