In-Season Stuff+ Improvers
A look at which pitchers improved their stuff+ on individual pitches when comparing March-April to May-June.
I have been putting in some extra thought about where I want to go with baseball writing and whatnot in the next few years, and I think I want to start moving toward doing more stuff here and less stuff on RotoBaller. That will cost me some dough in the short term, but I think it’s the right move for the long term, and there are certain other advantages to it as well.
I can be as brief or as long as I want, and I don’t have to worry too much about typos or saying things the “correct” way. Watch out, I might even say taboo words like “auction draft” and “player ownership”! It’s going to get dodgy, real fast!
So, unless my mind changes, you’ll be getting more analysis pieces like this on the SubStack. I will typically tease some of it for everybody to read, but then leave the best parts of it for paid subs. This will probably include full data extracts, extra plots, and maybe even some audio commentary from me on the subject.
I will use a “Research” tag on these posts so we can have a page to go to where we see a list of things and you don’t just get totally cluttered out with the daily notes and game previews posts that flood the feed.
So this is our first one. I want to go over in-season Stuff+ changes to see if any pitchers have changed a lot this season. We have to be careful with Stuff+, because it’s not rare at all to see a pitcher with good Stuff+ struggling in the box score, and vice versa. We’ll take the context of each pitcher we talk about and do this right, so let’s have at it.
Disclaimer: All Stuff+ data comes courtesy of Drew Haugen. It’s not the same model as you’ll find on FanGraphs or elsewhere.
The split I used was March-April vs. May-June. That gives us an even split since it’s June 2nd as I write this.
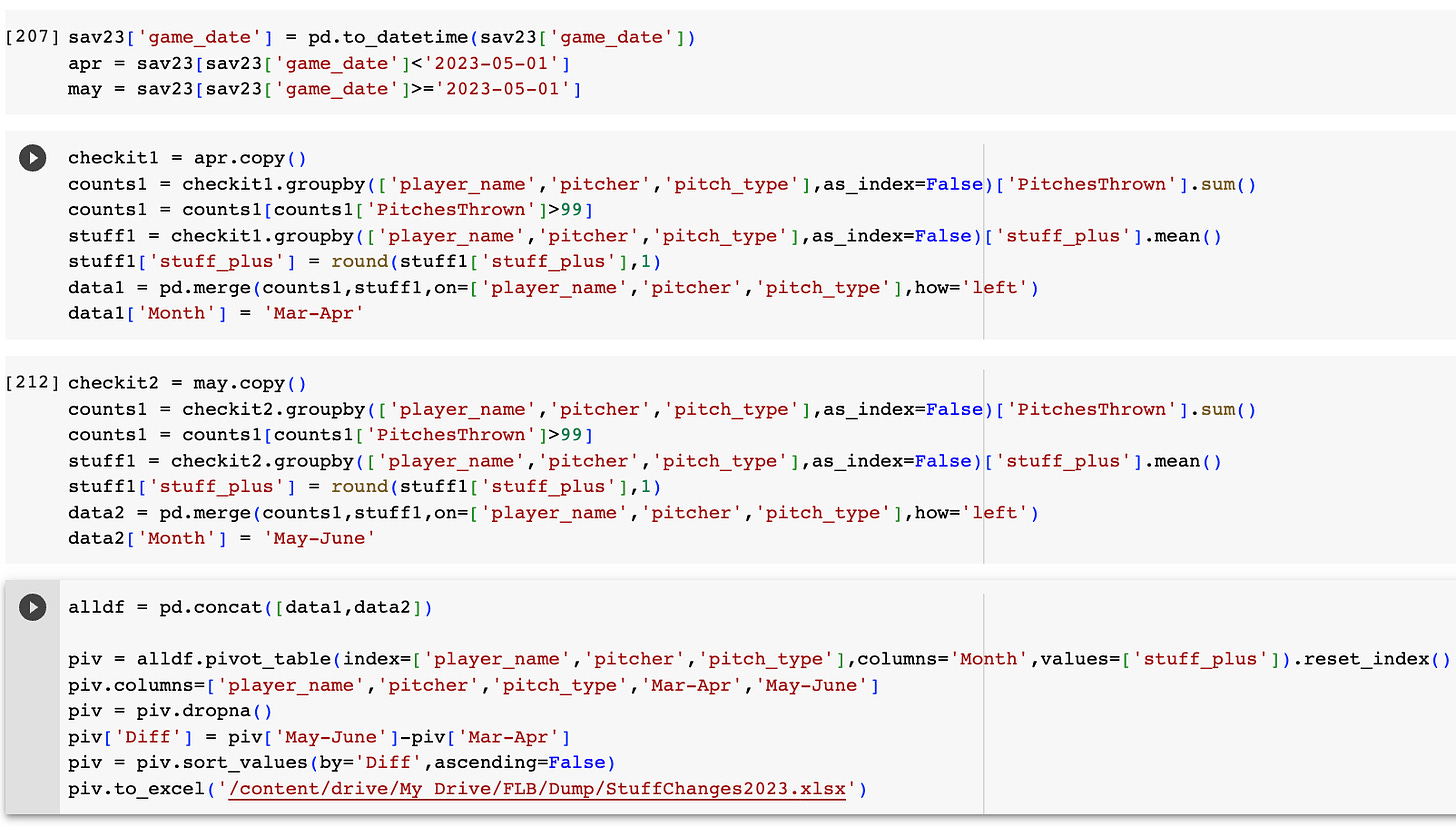
I can even sprinkle in some Python code while I go, even though this won’t directly help anybody since nobody else has the dataset that I do set up the way I set it up.
Here we go, I’ll give you the top three names for free and then provide more names and the full data set for paid subscribers.
#1 Spencer Strider’s Slider
I’m not sure how the hashtag #StriderSlider hasn’t caught on, but I’m going to try to make it happen
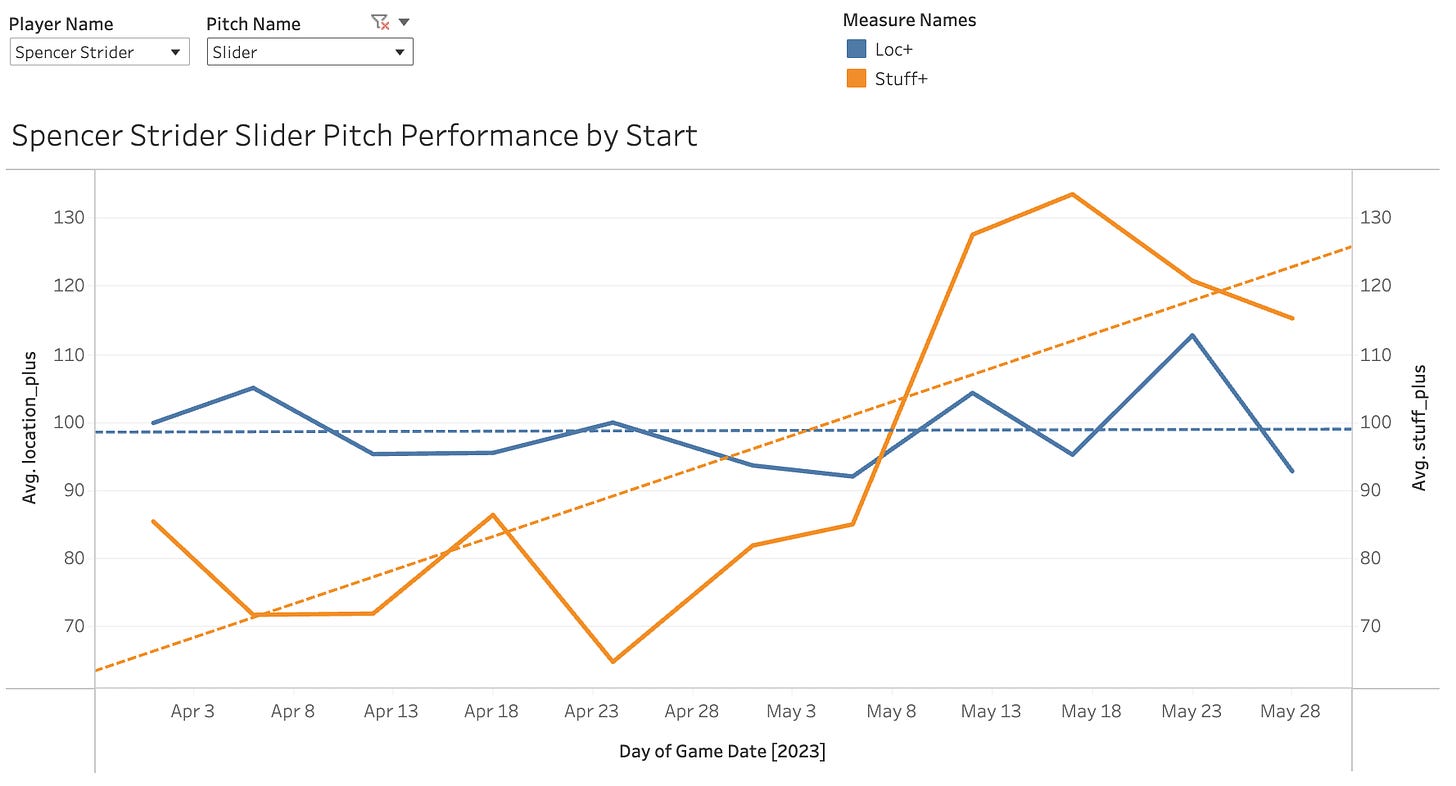
The one criticism someone sorta maybe coulda tried to make on Strider’s April is that his slider was below average by the Stuff+ mark. Well that didn’t last long, as the pitch took a massive hike starting in his second start of the month of May.
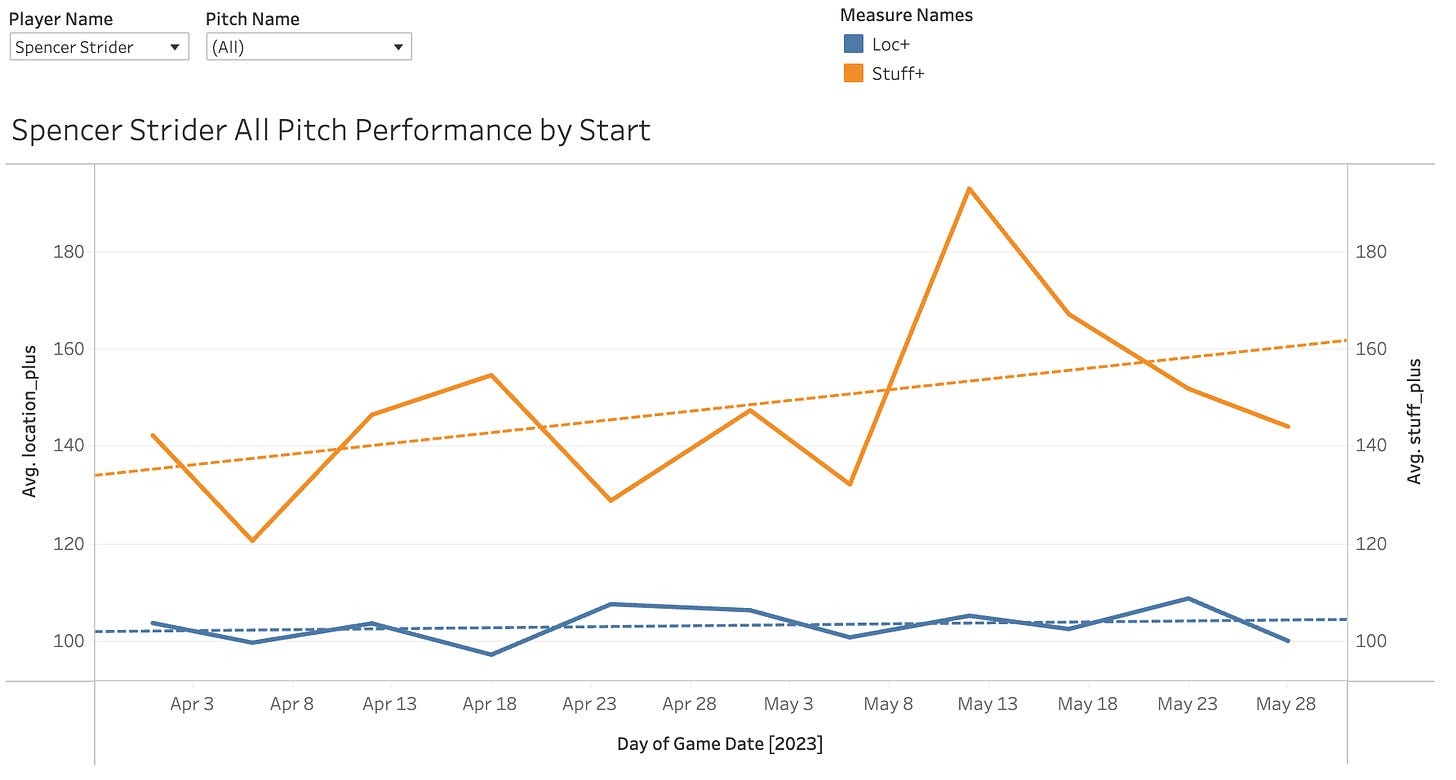
That led to his overall Stuff+ going from 138 in April to 156 in May.
Now, let’s take it easy here, because the actual outputs haven’t improved in May.
SwStr%
Apr: 21.3%
May: 21.9%
K%
Apr: 42.6%
May: 41.0%
But look, if you have a guy putting up a 21% SwStr% and a 43% K% in April, you should be overjoyed if those numbers stay anywhere close to that in the next month. The numbers are so high it’s almost hard to believe it’s possible to sustain - but Strider has been doing this stuff for a full year now.
There’s no real actionable advice I can give you on Strider other than just hold on tight and enjoy the eliteness if you have him.
#2 Logan Gilbert’s Slider
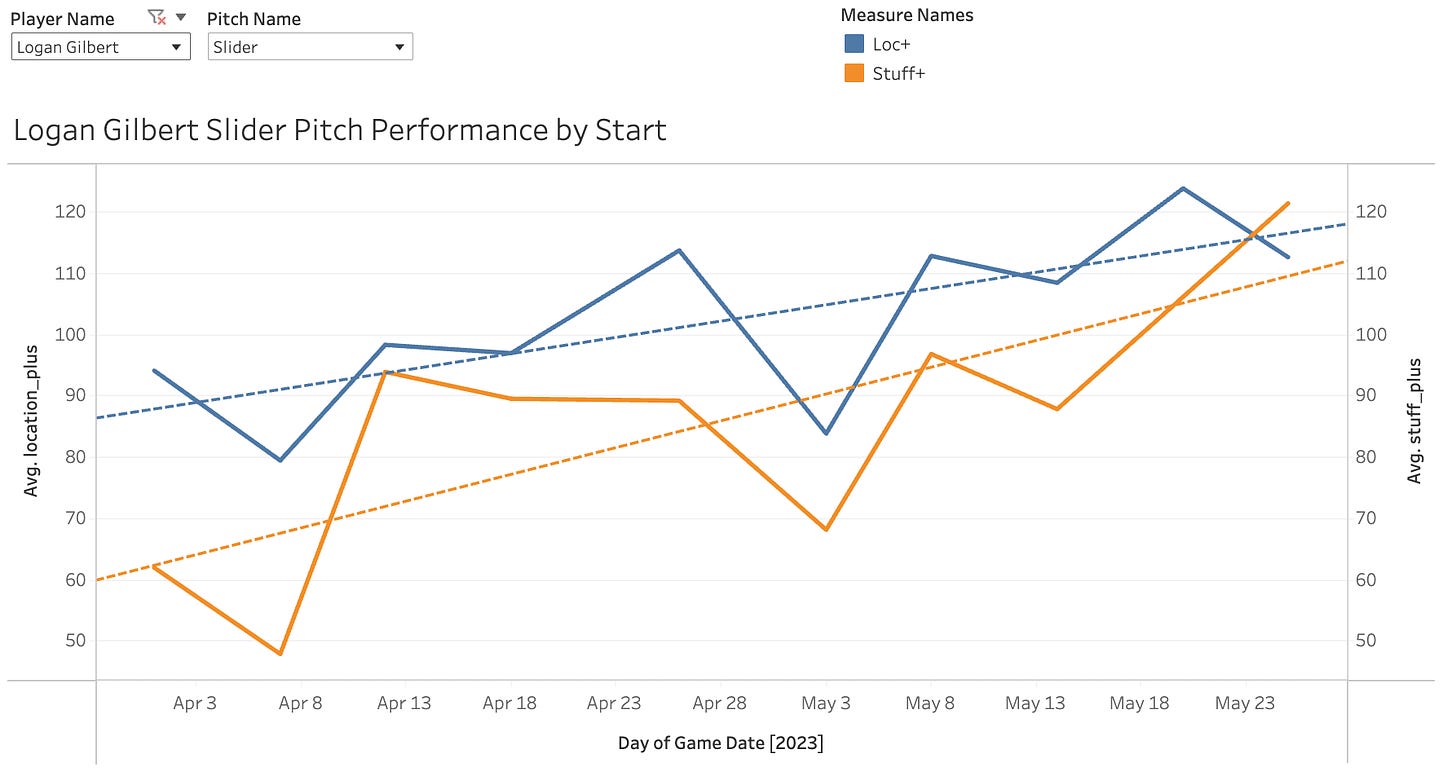
Gilbert toyed with ace-hood in 2021 and kind of fell off in 2022, but the upside certainly remained and he’s having his best season so far this year.
In April:
12.4% SwStr%
30.1% K%
4.4% BB%
50.1% Strike%
In May:
13.8% SwStr%
27.7% K%
4.3% BB%
51.1% Strike%
A good tick up on the SwStr% followed the Stuff+ improvement, but the K% actually got worse while the BB% stayed the same. But it’s a K-BB% well above 20% in both months, so I don’t care about the slight regression there. Gilbert, I think, is a fantasy ace now. If we were drafting again today I’d say he’d easily be a top-25 SP pick, if not much higher.
#3 Aaron Nola’s Curveball
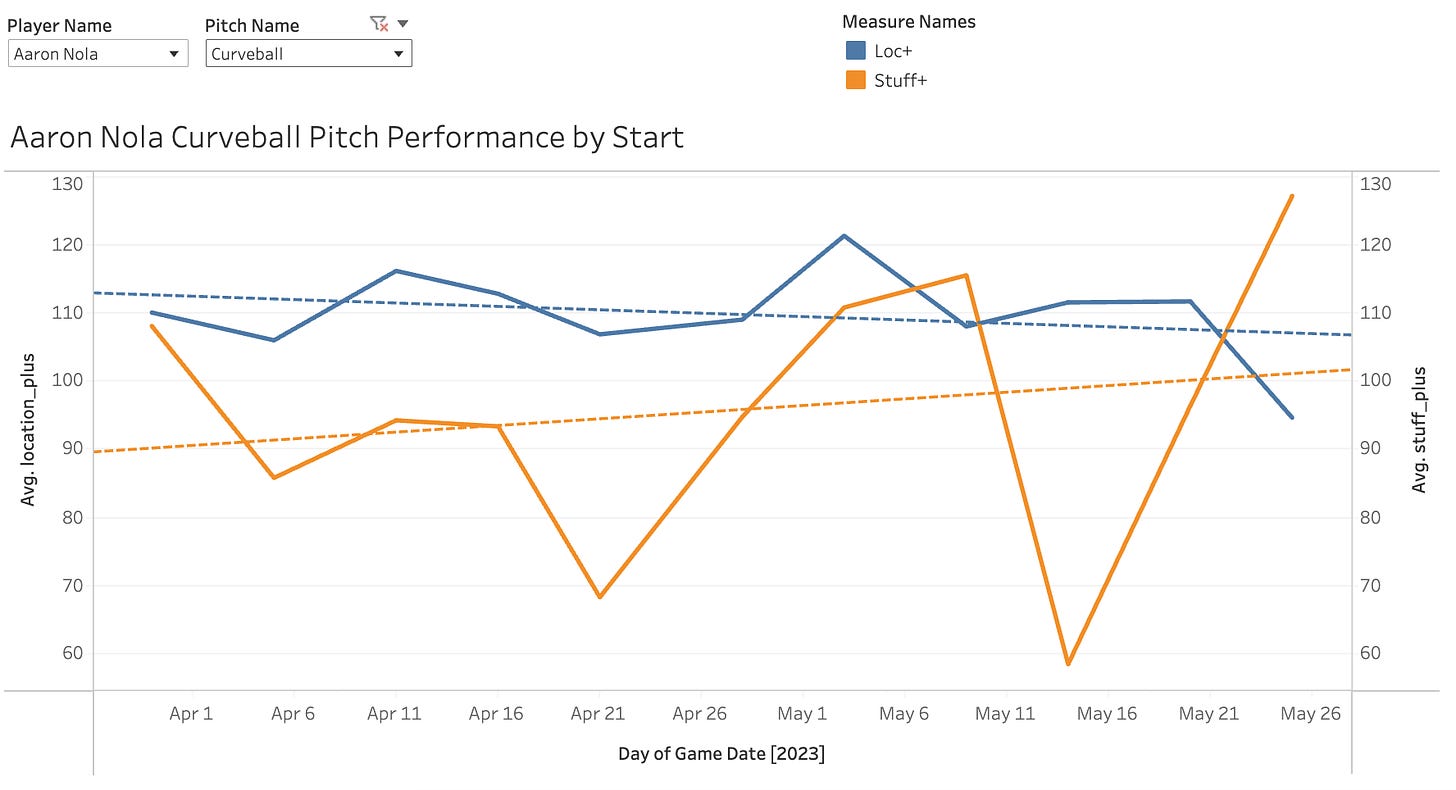
This is an encouraging sign after Nola struggled out of the gate. The curveball has been improving throughout the year, although it has come in a bit of an up-and-down fashion:
You can see the three highest points have all come after May 1st, and the five or the six lowest were in April.
In March/April:
10.2% SwStr%
47.8% Strike%
19.3% K%
6.2% BB%
In May:
12.8% SwStr%
47.2% Strike%
23.6% K%
5.7% BB%
He still hasn’t been the 28% K%-5% BB% guy we came to know the last several years, but the improvement is clear.
And now the paywall! Subscribe to get the rest of this post, the full versions of the many posts I’ll write in the future, daily projections, season-long projections, dashboards, betting tips, DFS picks, and so much more!


