Introducing and Explaining RISP H%
An explanation of what "RISP H%" is and how to best use it.

One of the best ways to be able to predict the future is to know which players have been on one of the two extreme sides of variance. We want to find the statistics that have a strong bearing on the output statistics (like ERA, batting average, etc.) and have a lot of variance in them that will regress to the mean over time.
We typically talk about three luck metrics on the pitching side.
Batting Average on Balls In Play (BABIP)
Home Runs Per Fly Ball (HR/FB)
Left on Base (LOB% / Strand Rate)
Those are good things to know and highlight when evaluating a pitcher with your eye on the future. We know they all tend to regress toward the mean, and they have a strong hold on what your end-of-year WHIP and ERA will be.
My goal over the years with the tools I have developed is to make myself a place where I don’t have to ever go to any other website to get what I need to do the best player analysis. And as the years and months have gone by, I’ve gotten closer and closer to that goal.
The one thing I didn’t have as of mid-2025 was a LOB% statistic. I would have just added LOB% to the dashboards and reports and been done with it, but the dataset (the pitch-by-pitch dataset from baseball savant) doesn’t make that easy to calculate. It would have been a very complicated script and it wouldn’t have resulted in 100% accurate results for reasons I won’t get into here.
So I came up with an idea to emulate. What I came up with is RISP H%. It’s a bad name for it, no doubt about it. But I’m not an artist. It is simply the percentage of the hits a pitcher gives up that come when at least one runner is in scoring position.
If you give up a hit with RISP, you’re usually giving a run there. It’s similar to LOB% in the fashion that it’s driving out finding out how often runners that reach base against a pitcher are scoring.
This whole thing hinges on the idea that no pitcher can truly control this more than other pitchers. Certain pitchers will allow hits at a much better or worse rate than other pitchers, of course, but what you won’t find is a pitcher who consistently, year in and year out, finds ways to limit hits more often when runners are on base. If they could give up fewer hits in certain situations, they would just do it in all situations.
But I need to prove that point and put some numbers on this. First, let’s start with RISP H% and its correlation to LOB%.
I took all qualified pitcher seasons from 2021 to the middle of 2025 and did the correlation matrix in Excel. We get a number of -67.
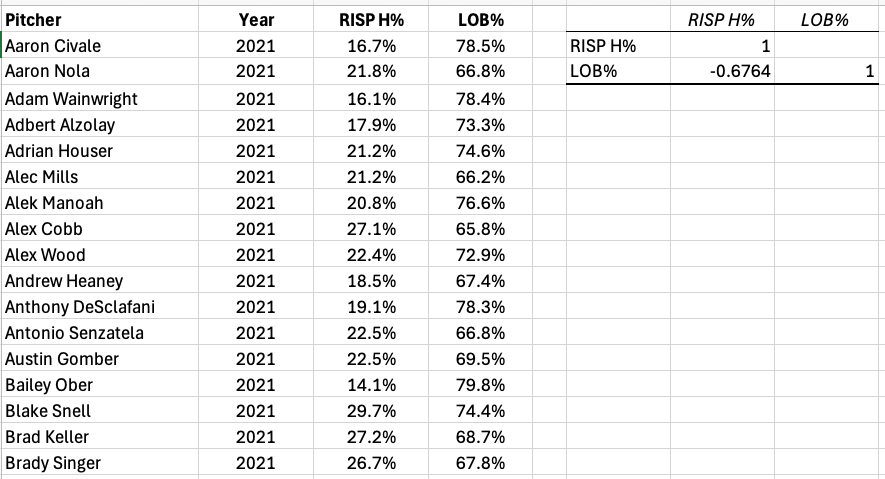
That shows a decently strong negative correlation between RISP H% and LOB%. Meaning that as LOB% goes up, you expect RISP H% to go down, but not every time, and not in a perfect relationship.
This is not similar to the correlation we found between JA ERA and SIERA, which was almost a perfect correlation since they’re using almost exactly the same calculation.
There will be differences, but generally you’ll see the numbers lining up. If we look at the highest RISP H% seasons of the last five years:
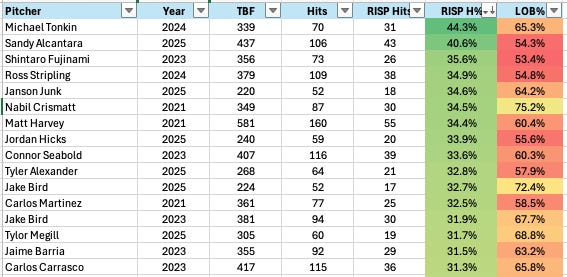
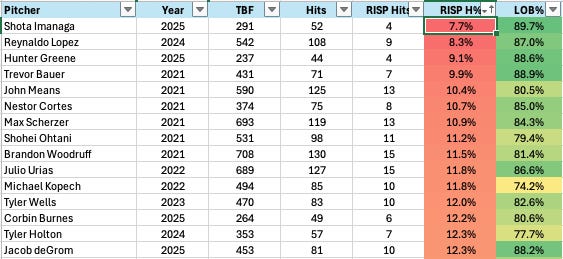
We see low (red / orange in this case) LOB%. And vice-versa:
It’s fair to say that this is not the same statistic, but it serves the same purpose.
Now, let’s check year-over-year correlations for individual pitchers.
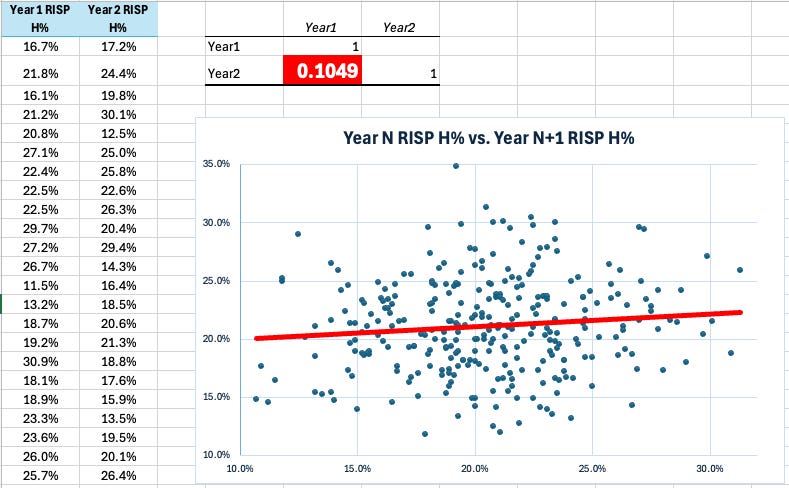
What I did there was compare 2021 to 2022, 2022 to 2023, and 2023 to 2024 for pitchers who qualified in both season samples in each pairing. The question you’re answering with this:
If pitcher a has a low RISP H% in year, does that mean that they’re more likely to have a low RISP H% the following year?
If this correlation number (in red background) was above 0.5 or so, that would mean “yeah kinda”. And as the number gets closer to 1, you get more and more confident saying that this pitcher will deliver another number next year like they did this year.
In this case, the number is 0.105, which is an insignificant relationship - randomness reigns. If this were a “sticky” stat and there was a strong relationship here, you’d see the red trend line being on a slope from bottom left to top right. But we see a mostly flat line here, and our point is proven.
This also would work month-to-month or start-to-start.
Let’s break down the distribution here.
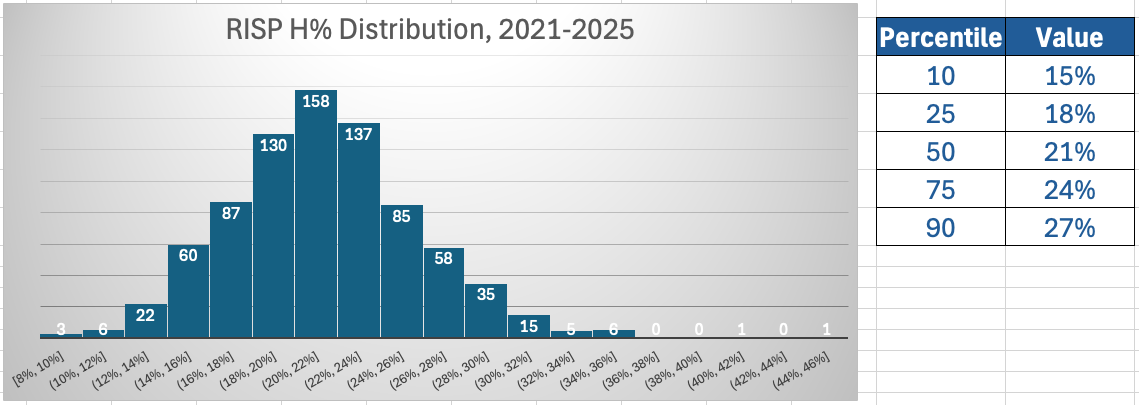
This shows you what is normal, what is high, and what is low. The average (50th percentile) we find is 21%. The three tallest bars there congregate right around 21%. This tells you that 425 of the 809 pitcher sample (53%) put up RISP H% values between 18% and 24%.
Only 1.1% of the sample went below 12%, and only 1.6% of the sample went above 32%.
The number for each pitcher, as time goes by, will gravitate toward 21%.
Let’s take some examples to really drive the point home.
Positive Regression Example
2023 Hunter Brown: 28% RISP H%, 69% LOB%, 5.09 ERA
2024 Hunter Brown: 17% RISP H%, 77% LOB%, 3.49 ERA
Brown was well above the expected mark of 21% in 2023, so it was very likely for him to improve and leave more runners on base in 2024, and that happened. Along with plenty of skill improvements, he knocked his ERA down more than 1.5 runs.
Negative Regression Example
2022 Alek Manoah: 13% RISP H%, 83% LOB%, 2.24 ERA
2023 Alek Manoah: 29% RISP H%, 71% LOB%, 5.87 ERA
This is an extreme example, and the ERA bloating has to do with a lot more than just how many runners he left on base, but it shows the point well.
Manoah had one of those outlier RISP H% values in 2022, and he also posted an extremely high LOB%. It was easy to see that regressing negatively for him. Unfortunately for Manoah, he went the complete other way and ended up posting an outlier in the other direction the following season.
Your expectation for next season should always be 21%. The past doesn’t matter in this stat.
The “Right Now” Application
This article is meant to be an “evergreen” article that I just save for people to read for the coming years when they’re new and see this stat for the first time and want to know what it is. But, since we’re here, and most of you reading it are reading it around the time I’m publishing it, let’s show off some of these outliers from the 2025 season as things stand right now on July 23rd.
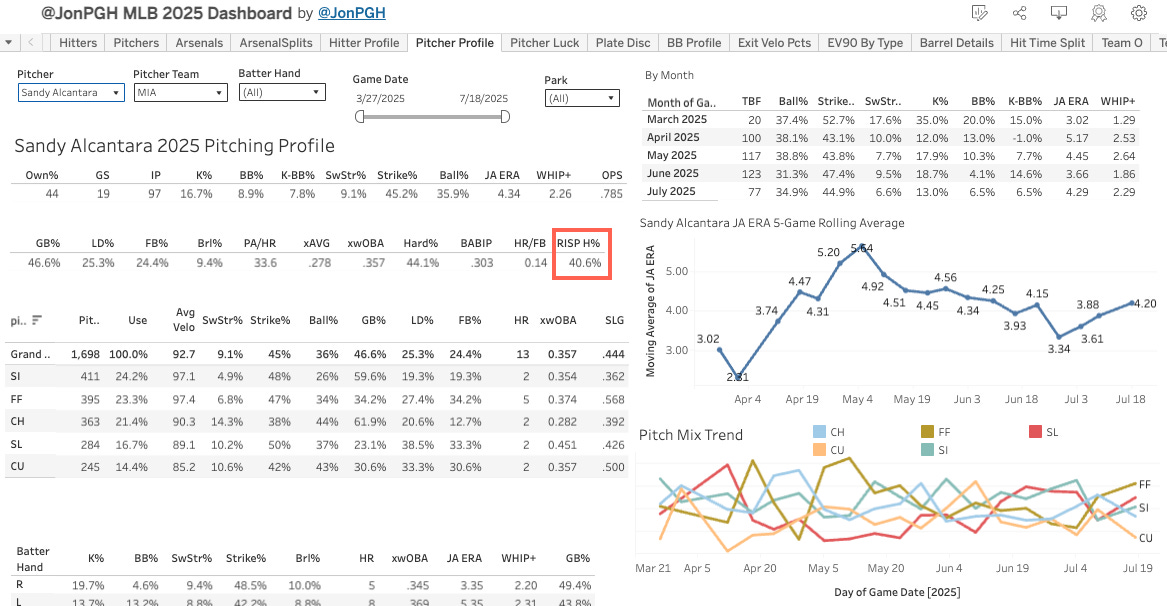
Positive Regression Coming
Sandy Alcantara 41%
Janson Junk 35%
Jordan Hicks 34%
Tyler Alexander 33%
Jake Bird 32%
Tylor Megill 32%
German Marquez 31%
Jake Irvin 30%
Luis Severino 30%
Mitchell Parker 29%
Ben Casparius 29%
Jimmy Herget 29%
Ben Brown 29%
Sean Newcomb 29%
That’s everybody currently over 29%, the true “tail” pitchers. They should all do better in this regard for the rest of the season (if they’re healthy and pitching in the Majors, of course, which many of them are not).
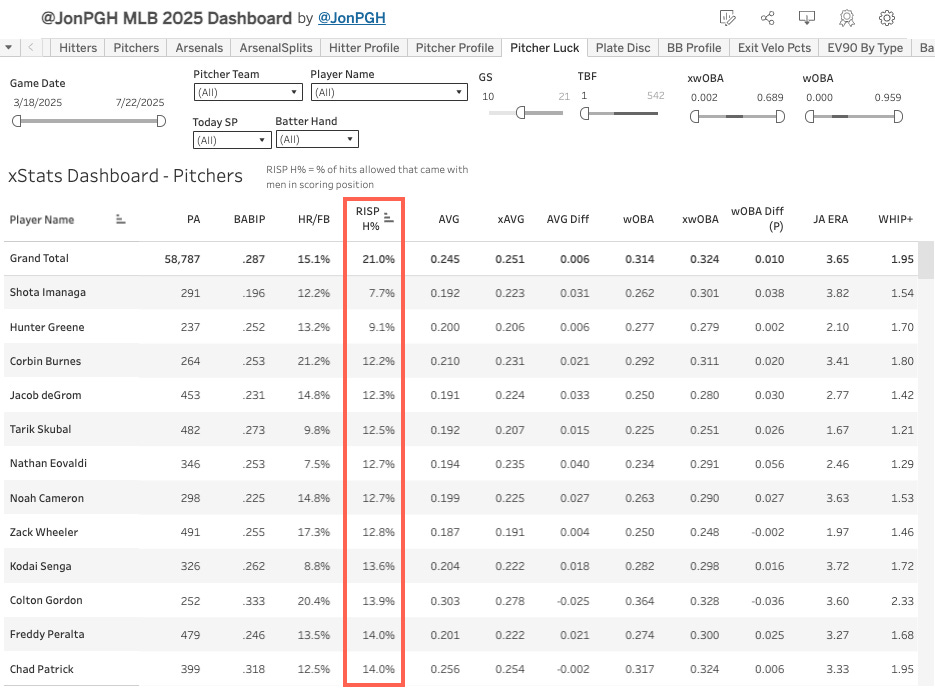
Negative Regression Coming
Shota Imanaga 8%
Hunter Greene 9%
Corbin Burnes 12%
Jacob deGrom 12%
Tarik Skubal 13%
Nathan Eovaldi 13%
Noah Cameron 13%
Zack Wheeler 13%
Kodai SEnga 14%
Colton Gordon 14%
Chad Patrick 14%
Freddy Peralta 15%
Bryan Woo 14%
Clarke Schmidt 14%
Colin Rea 14%
That’s everybody under 15%.
Since you’re seeing some stud names there, you might be tempted that indeed, the elite of the elite (deGrom, Skubal, Greene, Wheeler) might actually be able to really buckle when RISP and actually reliably put up a super low number here. But the data doesn’t show that:
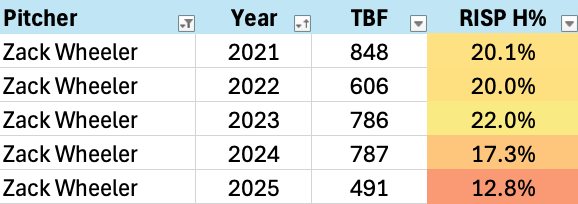
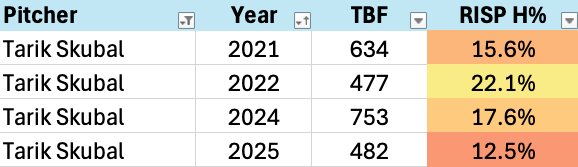
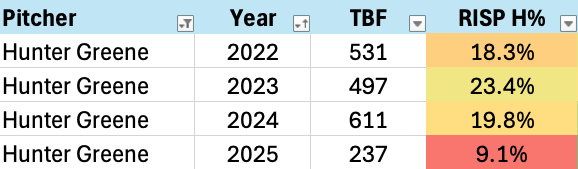
There’s only season shown there well above the 21% league average (Hunter Greene 2023), but the majority of the values are in the normal range between 18% and 24%.
So that’s it. If you’re already using LOB% in your analysis, there’s no reason to take this stat in as well. It’s not any more useful than LOB% (I don’t think), and they’re both mostly measuring the same thing, so it makes sense just to choose one and go with it.
But it integrates really nicely into my dashboards, so I will be using it a lot as we go forward. You can find on the main dashboard (check the resource glossary for that link) on the Pitcher Luck tab and also the Pitcher Profile tab, and both will adjust to whatever parameters and filters you put on.