Introducing and Explaining WHIP+
A look at WHIP+, which I have come up with as an alternative to the standard WHIP stat.
I have come up with this new stat that I’m calling WHIP+. It’s already on the main MLB dashboard, and I’ll be citing it more and more as we move forward (especially in the off-season), so I felt that I needed to write a full post about it that I can point to in the future for the explanation.
I’m probably giving myself too much credit with the “I have come up” phrase there. This wasn’t some genius idea. It’s not complicated; it’s not something nobody has ever done before, but it’s not something you can find anywhere other than my dashboard currently, so I’ll claim it. But don’t worry, I won’t try to sue you if you have the same idea. And please don’t try to sue me if you had this idea before me, like many of you have.
What Is It
It’s a way to enhance WHIP to give extra-base hits more weight, and to also count hit by pitch. Tradition WHIP does neither of those things. These three innings will all give you the same WHIP:
OUT, OUT, WALK, OUT = 1.00 WHIP
OUT, OUT, HOMER, OUT = 1.00 WHIP
HBP, HBP, HBP, HOMER, OUT, OUT, OUT = 1.00 WHIP
I took that last example to the extreme to make my point!
The calculation for WHIP+:
(BB + HBP + 1B + (2B*2) + (3B*3) + (HR*4)) / IP
In short, it’s total bases allowed per inning pitched. I call it WHIP+ because “TBIP” sounds stupid. So you will be punished for hitting batters and giving up homers.
What to Expect
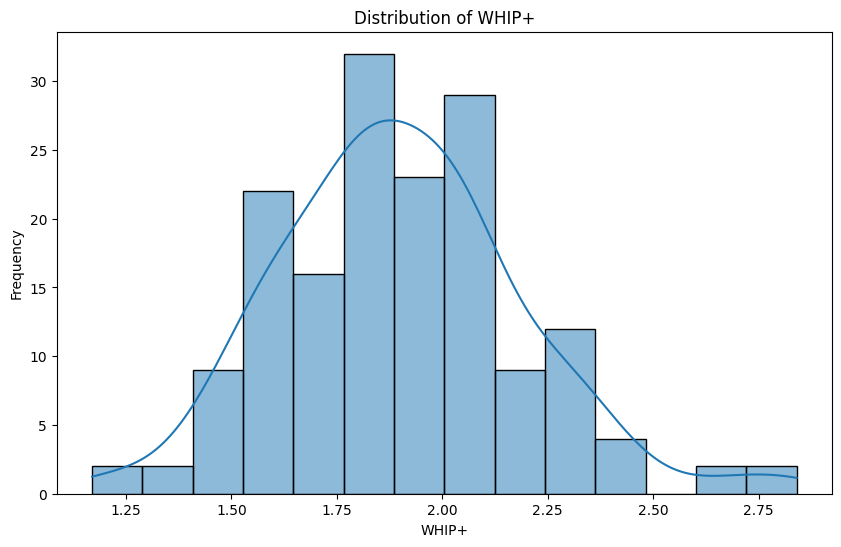
It’s useless to cite a statistic if nobody knows what’s good or bad. So let’s talk about that. Here’s the distribution using 2024 data for pitchers with at least 75 innings pitched.
Here are some numbers on that:
League Average: 1.88
25th Percentile: 1.71
75th Percentile: 2.05
That would mean that anything below 1.70 is very good and anything above 2 is pretty bad. The current league leader at the time of this writing is Tyler Holton at 1.17. The worst in the league is Roddery Munoz at 2.84. That gives you an idea about what the max and min will look like.
How Does It Correlate
I compared 2023 WHIP and WHIP+ with 2024 ERA. Here’s WHIP:
Correlation: .405
Here is WHIP+:
Correlation: .462
Both are somewhat correlated to future ERA, but not in a super strong manner. And WHIP+ is indeed more predictive of future ERA than WHIP. I think it’s fair to say it’s just a better statistic than WHIP overall. So that’s what I’ll be using when appropriate moving forward.
Where to Find It
You will find this on my main MLB dashboard, which is available to paid subscribers. It’s completely sortable and filterable with dates or teams or whatever else you might want to filter by. Find it here:
Enjoy!


