Investigating Innings Jumps
I check into see if we should expect worse performance from pitchers who logged a bunch more innings last season
The Diamondbacks reached the World Series in 2023. Do you remember that? On their way there, their ace, Zac Gallen, threw way more innings than he had before. Here’s how this recent three-year sample went in regular season innings:
2022: 184 IP
2023: 210 IP
2024: 148 IP
I want to also measure his performance in this sample to make my point. Here are his SIERAs from these three seasons:
2022: 3.32
2023: 3.67
2024: 3.85
The innings increase came from 2022 to 2023. We would then wonder if that might affect his performance in 2024. And in this case, the SIERA increased by 0.18 points. That’s not a huge margin, but it was noticeably worse.
The question then becomes: should we expect a worse performance from pitchers the year after they throw a ton more innings than they had before?
And I can now answer that question. I went back to 2010 looking for this.
SPs who reached at least 70 innings in three consecutive seasons
SPs in that sample who saw significant innings increases from year one to year two
This gives us a list of pitchers who shouldered big, often unexpected, innings loads and then pitched in the next season enough that we could check their performance.
I checked four innings increase thresholds:
At least 30 IP
At least 40 IP
At least 50 IP
At least 75 IP
Here’s how the data looks, using the 30 IP threshold and filtering to the most recent sample.
I’ll just take one example to really nail this home. Sonny Gray:
2022: 119 IP, 3.73 SIERA
2023: 184 IP, 3.95 SIERA
2024: 166 IP, 3.03 SIERA
Gray went +65 innings from 2022 to 2023 and then massively improved in 2024, knocking almost a full run off of his SIERA.
Individual examples don’t do anything for us, but since I’ve formatted the data this way, we can quickly take large-sample averages and form the basis for our future expectations.
Here’s the average SIERA change result from each innings threshold.
+30 IP: +0.14 SIERA (sample size = 218)
+40 IP: +0.13 SIERA (sample size = 163)
+50 IP: +0.10 SIERA (sample size = 125)
+75 IP: +0.06 SIERA (sample size = 57)
And now I can write a “therefore”!
Therefore, when we’re looking at a pitcher coming off a year where they massively increased their innings total, we should expect their SIERA to rise around 0.10 points.
Last year, there were 71 pitchers who reached 150 innings. The standard deviation of their SIERAs was 0.47.
So we’re talking about a movement of between one-fourth and one-fifth of one standard deviation. It moves you from the season that Jake Irvin had in 2024 to the season that Chris Bassitt had. That’s a very small movement.
There are just as many examples of pitchers improving after a big innings workload as pitchers getting worse.
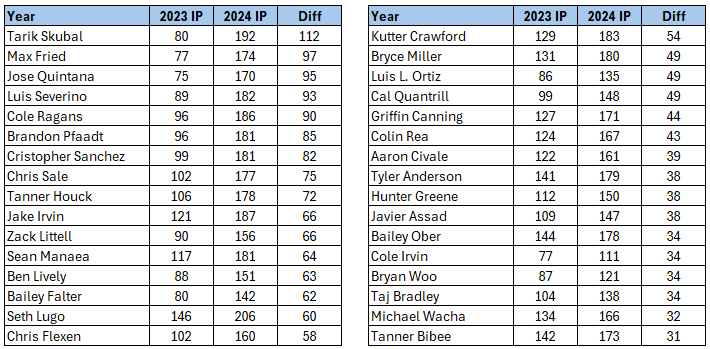
Here’s a list of starters who threw at least 30 more innings in 2024 than in 2023. This analysis should make you feel a little bit better about them for 2025:


