MLB Daily Notes - August 6th
A daily automated report of what happened yesterday in Major League Baseball, along with other recent trends and further analysis.
I have been handling poop near daily for 5.5 years now and man I’m tired of it. I cannot wait until I never have to handle another human’s poop again. But we’re not all that close to the end of the tunnel, and that assumes my wife doesn’t get pregnant again. It will be worth it if she does, as my daughter gets older and older I start longing to have another little girl, so I’m actually somewhat interested in the idea of having a fourth child, but I’m just hoping that the fourth kid comes out immediately potty trained.
It works against me as well that I work from home 100% of the time. I am never more than a few dozen feet away from the poop.
Pitcher Review
Speaking of poop, Zac Gallen had another bad outing.
7 IP, 8 H, 5 ER, 4 K, 2 BB
That’s 10 baserunners allowed and just a 9.7% SwStr%. Zac Gallen has been more like Zac Liter this year, amirite!?
Zac Gallen Stats by Year
Year….. K% | BB%
2019: 28.7% | 10.8%
2020: 28.2% | 8.6%
2021: 26.6% | 9.4%
2022: 26.9% | 6.6%
2023: 26.0% | 5.6%
2024: 22.9% | 7.9%
The lesson to be learned is that you are best served drafting someone with a very high strikeout rate as your ace. Beware of the mid-twenties K% when you’re drafting your first or second SP.
I only started with Gallen because I needed someone who did poorly so I could use the poop transition. The man of the day was clearly David Festa.
5 IP, 2 H, 0 R, 9 K, 2 BB, 17.1% SwStr%, 52.4% Strike%
The pitch mix from yesterday:
The fastball didn’t get whiffs, but earned a nice 52% Strike% anyways, and then the secondaries were devastating. For the year now:
This is a good case of what we talked about a couple of days ago. Short sample, new name, hard to evaluate. So we use SwStr% + Ball%. And so far, he checks out decently there with a 13.1% SwStr% and 34% Ball%. The fastball velocity is not great, but it’s well above the danger zone at 95mph. And the slider is elite.
David Festa Stuff+ by Pitch
FF: 107.6
SL: 119.4
CH: 72.9
Overall he has a 104.2 Stuff+, 101.6 Location+, and a 104.8 Pitching+. Pretty good numbers. It’s really encouraging sign for the Twins as they try to piece together the last guy or two in their potential playoff rotation.
Sean Manaea had the best outing of the day. He’s just less interesting for fantasy purposes since he’s been mediocre for so long. So that’s why I dubbed Festa the man of the day, don’t get mad at me Manaea bro’s.
7 IP, 6 H, 0 R, 10 K, 0 BB, 12.7% SwStr%, 54.9% Strike%
To his credit, he’s been very good. Since June 14th:
59.1 IP, 26.2% K%, 8.9% BB%, 2.28 ERA
But this is Sean Manaea. Every year he goes on a run where people are like oooHhooohHH hE’s finALly FiguReD It oUT. But no, he hasn’t. He’s a fine pitcher, but he’s someone to rely on for fantasy purposes.
Sean Manaea SIERA by Year
2016: 4.04
2017: 4.51
2018: 4.46
2019: 3.86
2020: 4.01
2021: 3.68
2022: 3.90
2023: 3.83
2024: 4.09
His worst SIERA in six years, and his best ERA since 2019 when he made just five starts. It’s the best ERA of his career when you get rid of that season. I don’t like the guy, I don’t like him at all.
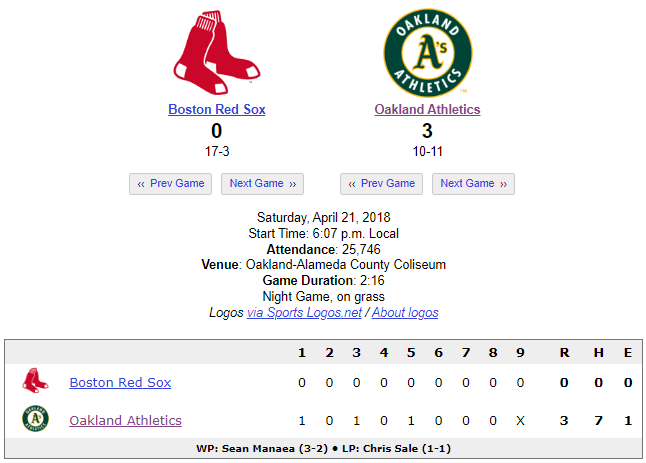
I think the main reason I don’t like him is that one time he threw a no-hitter against my fantasy team when I was on a beach vacation.
ACK-SHUALLY, looking into it, I could not possibly have been at the beach because we go to the beach in June, and the no-hitter was in April:
But I remember being somewhere different. Unless this is a completely false memory. I wasn’t even tweeting much in April 2018 so I can’t even find tweets that tell me where I was. Very sad stuff. We may never know.
I wonder what other memories I have that didn’t actually happen…
No other pitchers were really of note yesterday, so let’s move on!
Hitter Review
Tyler Fitzgerald homered again after my diatribe against him yesterday. He raised that average EV on homers with a 103.2 mile per hour shot in the first inning.
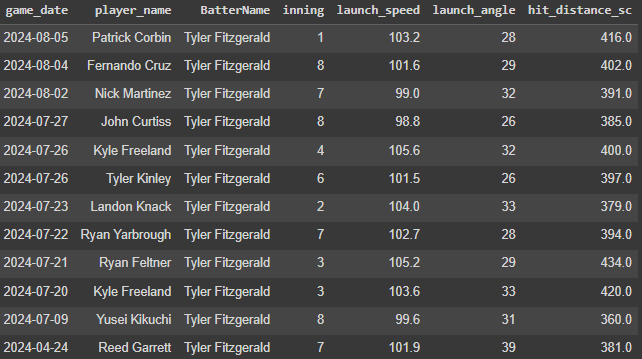
A new rule I am proposing though is that home runs hit against Patrick Corbin since 2021 should simply not count. So here’s the list of all of those homers I am dis-counting. That takes away four from Pete Alonso, and three from Rhys Hoskins, Andrew McCutchen, Francisco Lindor, and Austin Riley. These will be retroactively applied to your old fantasy leagues.
Absolutely sell Tyler Fitzgerald. Sell him now.
Elly De La Cruz was the top point scorer with two dingers, three runs, and three RBI. He didn’t steal any bases though, loser! His season now:
474 PA, .261/.347/.496, .844 OPS, 30.2% K%, 10.3% BB%, 20 HR, 57 SB
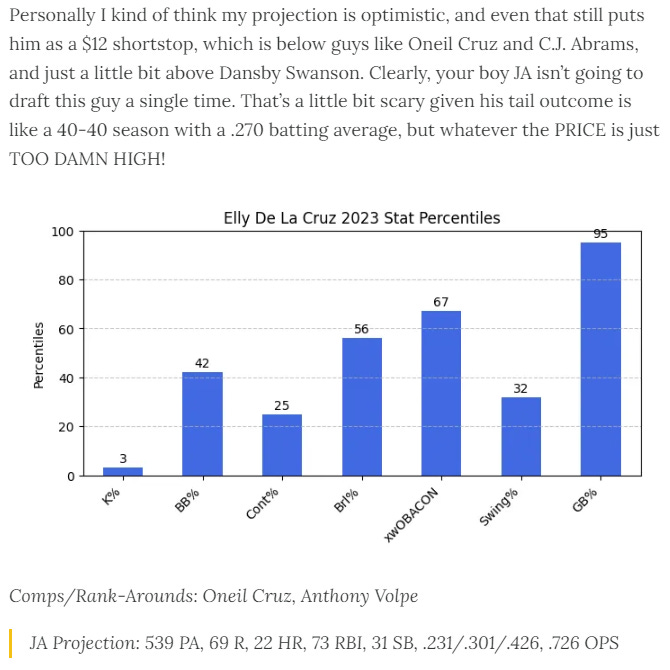
I wonder what I wrote about him in the pre-season.
Here’s a screenshot:
So he’s already beaten my projection in runs and is coming up on doubling it in steals. He will surely beat the home run projection. So it was a bad job by the model, and a bad job by me not drafting him at all.
The key to his success is improvements in the things we talked about with him: strikeout rate and ground ball rate.
They’re still not great with a 30% K% and a 47% GB%, but he didn’t need to get them into great territory to turn into a fantasy stud given the raw power and steals ability.
2023: 3.6 LA, 55.3% GB%, 33.7% K%, .303 xwOBA
2024: 10.2 LA, 47.1% GB%, 30.2% K%, .337 xwOBA
Let’s take a quick trip through your top 10 hitting points leaders on the year.
#1 Shohei Ohtani: 1,339 points
.311/.399/.633, 34 HR, 86 R, 81 RBI, 31 SB
#2 Aaron Judge: 1,329 points
.324/.458/.704, 41 HR, 87 R, 103 RBI, 5 SB
#3 Bobby Witt Jr.: 1,271 points
.343/.389/.587, 20 HR, 94 R, 80 RBI, 25 SB
#4 Juan Soto 1,194 points
.310/.437/.598, 28 HR, 93 R, 78 RBI, 5 SB
#5 Elly De La Cruz 1,187 points
.261/.347/.496, 20 HR, 73 R, 48 RBI, 57 SB
#6 Gunnar Henderson 1,184 points
.392/.379/.567, 29 HR, 93 R, 69 RBI, 14 SB
#7 Jose Ramirez 1,169 points
.279/.332/.543, 29 HR, 84 R, 94 RBI, 24 SB
#8 Jarren Duran 1,145 points
.295/.353/.514, 14 HR, 78 R, 58 RBI, 27 SB
#9 Ketel Marte 1,067 points
.302/.368/.560, 28 HR, 78 R, 78 RBI, 6 SB
#10 Francisco Lindor 1,052 points
.253/.331/.458, 22 HR, 74 R, 64 RBI, 23 SB
Is Gunnar Henderson home run derby cursed though!?
First Half: .286/.373/.584, 28 HR, 14 SB, 23.6% K%, 10.9% BB%
Sec Half: .328/.419/.469, 1 HR, 0 SB, 16.2% K%, 13.5% BB%
That actually just looks like randomness, which of course is the answer most of the time. The power and strikeouts have both come way down. If there’s a non-random explanation for it, it would be that he’s swinging the bat more slowly now. And since we have bat tracking, we can actually check it.
Before Break:
After Break:
So no noticeable change there. Exit velocity comparison:
1st Half: 89.4 average, 108.9 90th percentile
2nd Half: 88.9 average, 107.9 90th percentile
So it’s just bad variance for a couple of weeks, and that’s only in power and steals. It’s good variance in the batting average department.
But there is a lesson to be learned here. People sometimes talk about how being in the home run derby can mess up a guys’ swing, and the way they try to prove that is by comparing second half vs. first half numbers.
And if you check, you will absolutely find that all star players and home run derby contestants do get worse in the second half as compared to the first half. But this has nothing to do with the all star events themselves, it’s simply regression to the mean in action.
How do you get to the home run derby? You hit a lot of home runs in the first half.
How do you hit a lot of home runs in the first half? You get somewhat lucky.
Your average all-star and home run derby participants will be coming off of a first half where they had at least some level of good fortune. Thereby making the natural regression likely to make their second halves worse than the first. A beautiful statistical lesson which can be applied to a wide variety of things in life.
If I forget to change the poopy diaper tomorrow before my wife wakes up, that’s just natural regression man. I was running hot those last five days changing that diaper every day. I was due for a failure.
So long, readers.
Pitcher Reports
Algo SP Ranks - Yesterday
1. Tyler Glasnow
2. David Festa
3. JP Sears
4. Sean Manaea
5. Nick Martinez
6. Brady Singer
7. Patrick Corbin
8. Kyle Hendricks
9. Aaron Nola
10. James Paxton
11. Andrew Heaney
12. Logan Webb
13. Zac Gallen
14. Hunter Brown
15. Ky Bush
16. Andre Pallante
17. Logan Allen
18. Roddery Munoz
Fantasy Points Leaders - Yesterday
1. Sean Manaea (vs. STL): 36.15 Points
2. David Festa (vs. CHC): 30.85 Points
3. Tyler Glasnow (vs. PHI): 26.5 Points
4. JP Sears (vs. CWS): 25.35 Points
5. Nick Martinez (vs. MIA): 22.85 Points
6. Logan Webb (vs. WSH): 18.56 Points
7. Andrew Heaney (vs. HOU): 18.3 Points
8. James Paxton (vs. KC): 17.9 Points
9. Hunter Brown (vs. TEX): 16.5 Points
10. Kyle Hendricks (vs. MIN): 15.9 Points
Whiffs Leaders - Yesterday
1. Tyler Glasnow (LAD): 17 Whiffs (91 Pitches)
2. Brady Singer (KC): 16 Whiffs (107 Pitches)
3. David Festa (MIN): 14 Whiffs (82 Pitches)
4. Sean Manaea (NYM): 13 Whiffs (102 Pitches)
5. JP Sears (OAK): 13 Whiffs (89 Pitches)
6. Aaron Nola (PHI): 12 Whiffs (96 Pitches)
7. Patrick Corbin (WSH): 11 Whiffs (90 Pitches)
8. Nick Martinez (CIN): 9 Whiffs (70 Pitches)
9. Logan Webb (SF): 9 Whiffs (95 Pitches)
10. Zac Gallen (ARI): 9 Whiffs (93 Pitches)
Strike% Leaders - Yesterday
1. Sean Manaea (NYM): 54.9 Strike%, 27.5 Ball%
2. Tyler Glasnow (LAD): 52.7 Strike%, 31.9 Ball%
3. David Festa (MIN): 52.4 Strike%, 37.8 Ball%
4. Kyle Hendricks (CHC): 50.5 Strike%, 31.2 Ball%
5. Nick Martinez (CIN): 50.0 Strike%, 30.0 Ball%
6. Logan Webb (SF): 49.5 Strike%, 32.6 Ball%
7. James Paxton (BOS): 48.9 Strike%, 31.1 Ball%
8. Patrick Corbin (WSH): 47.8 Strike%, 32.2 Ball%
9. JP Sears (OAK): 47.2 Strike%, 31.5 Ball%
10. Aaron Nola (PHI): 44.8 Strike%, 34.4 Ball%
11. Hunter Brown (HOU): 43.3 Strike%, 39.2 Ball%
12. Logan Allen (CLE): 42.9 Strike%, 36.9 Ball%
13. Andrew Heaney (TEX): 42.5 Strike%, 38.8 Ball%
14. Andre Pallante (STL): 42.2 Strike%, 38.9 Ball%
15. Brady Singer (KC): 42.1 Strike%, 39.3 Ball%
Pitches/Out (POUT) Leaders - Yesterday
1. Shaun Anderson: 62 Pitches, 16 Outs, 3.88 POUT
2. Zac Gallen: 93 Pitches, 22 Outs, 4.23 POUT
3. JP Sears: 89 Pitches, 21 Outs, 4.24 POUT
4. Andrew Heaney: 80 Pitches, 18 Outs, 4.44 POUT
5. Nick Martinez: 70 Pitches, 15 Outs, 4.67 POUT
6. Sean Manaea: 102 Pitches, 21 Outs, 4.86 POUT
7. James Paxton: 90 Pitches, 18 Outs, 5.0 POUT
8. Patrick Corbin: 90 Pitches, 18 Outs, 5.0 POUT
9. Tyler Glasnow: 91 Pitches, 18 Outs, 5.06 POUT
10. Aaron Nola: 96 Pitches, 18 Outs, 5.33 POUT
Velo Changes - Yesterday
Andrew Heaney's SL velo (21 pitches) UP 1.7mph to 83.8
Patrick Corbin's FC velo (16 pitches) UP 1.6mph to 86.1
James Paxton's FF velo (18 pitches) DOWN -1.7mph to 92.5
JP Sears's SL velo (11 pitches) DOWN -2.5mph to 78.7
Pitch Mix Changes - Yesterday
David Festa's CH usage (36.6%) up 11.2 points
Hunter Brown's SI usage (36.1%) up 27.4 points
Hunter Brown's FC usage (23.7%) up 14.6 points
James Paxton's CU usage (45.6%) up 18.0 points
James Paxton's SI usage (31.1%) up 27.7 points
Nick Martinez's FF usage (31.4%) up 14.3 points
Nick Martinez's FC usage (28.6%) up 10.1 points
Sean Manaea's SI usage (50.0%) up 24.4 points
Sean Manaea's ST usage (29.4%) up 14.9 points
Tyler Glasnow's SL usage (46.2%) up 13.8 points
Zac Gallen's CH usage (25.8%) up 12.0 points
Pitch Mix Changes - Last 3 Starts
James Paxton 4-Seam Fastball: -20.0%
Yusei Kikuchi Curveball: -18.1%
Brady Singer Sinker: +18.1%
Hunter Brown Sinker: +17.2%
Sean Manaea 4-Seam Fastball: +16.9%
Blake Snell Curveball: +16.2%
Bailey Falter Slider: +15.4%
Kyle Harrison Slurve: +15.0%
Jose Quintana Curveball: +14.4%
Roddery Munoz Sinker: +14.2%
James Paxton Sinker: +13.9%
Randy Vasquez Cutter: +13.9%
Ryan Feltner Slider: -13.9%
Hunter Brown 4-Seam Fastball: -13.7%
George Kirby 4-Seam Fastball: -13.4%
Kyle Freeland 4-Seam Fastball: -13.3%
JP Sears 4-Seam Fastball: +13.1%
Tyler Glasnow 4-Seam Fastball: -13.1%
Framber Valdez Curveball: +12.8%
Tanner Houck Slider: -12.8%
Jonathan Cannon Sinker: -12.7%
James Paxton Curveball: +12.5%
Jose Soriano Sinker: +12.4%
Framber Valdez Sinker: -12.4%
Gavin Williams Slider: +12.3%
Logan Gilbert Cutter: -12.2%
Andrew Abbott Sweeper: +12.2%
JP Sears Sweeper: -12.1%
Edward Cabrera Sinker: +12.0%
CSW% Leaders - Last 3 Weeks
Blake Snell - 74 TBF, 39.3% CSW%
Framber Valdez - 73 TBF, 36.1% CSW%
Sonny Gray - 77 TBF, 35.2% CSW%
Spencer Schwellenbach - 75 TBF, 34.9% CSW%
Yusei Kikuchi - 69 TBF, 33.7% CSW%
Spencer Arrighetti - 73 TBF, 33.0% CSW%
Ronel Blanco - 67 TBF, 33.0% CSW%
Carlos Rodon - 71 TBF, 33.0% CSW%
Tyler Anderson - 75 TBF, 33.0% CSW%
Joe Ryan - 72 TBF, 31.8% CSW%
K% Leaders - Last 3 Weeks
Blake Snell - 74 TBF, 40.5% K%
Spencer Schwellenbach - 75 TBF, 38.7% K%
Carlos Rodon - 71 TBF, 35.2% K%
Yusei Kikuchi - 69 TBF, 34.8% K%
Dylan Cease - 72 TBF, 34.7% K%
Gavin Williams - 87 TBF, 34.5% K%
Framber Valdez - 73 TBF, 34.2% K%
Nick Pivetta - 85 TBF, 34.1% K%
Sonny Gray - 77 TBF, 32.5% K%
Spencer Arrighetti - 73 TBF, 31.5% K%
K-BB% Leaders - Last 3 Weeks
Spencer Schwellenbach - 75 TBF, 38.7% K-BB%
Blake Snell - 74 TBF, 31.1% K-BB%
Nick Pivetta - 85 TBF, 30.6% K-BB%
Carlos Rodon - 71 TBF, 28.2% K-BB%
Sonny Gray - 77 TBF, 27.3% K-BB%
Gavin Williams - 87 TBF, 26.4% K-BB%
Framber Valdez - 73 TBF, 26.0% K-BB%
Dylan Cease - 72 TBF, 25.0% K-BB%
Spencer Arrighetti - 73 TBF, 24.7% K-BB%
Shota Imanaga - 77 TBF, 24.7% K-BB%
GB% Leaders - Last 3 Weeks
Andre Pallante - 68 TBF, 69.2% GB%
Dylan Cease - 72 TBF, 62.5% GB%
Nathan Eovaldi - 96 TBF, 57.5% GB%
Nick Lodolo - 83 TBF, 56.9% GB%
Cristopher Sanchez - 77 TBF, 55.6% GB%
Zac Gallen - 105 TBF, 55.6% GB%
Logan Webb - 111 TBF, 54.9% GB%
Mitch Spence - 71 TBF, 54.9% GB%
Jameson Taillon - 70 TBF, 54.5% GB%
Grayson Rodriguez - 71 TBF, 54.2% GB%
Become a paid sub today to get the rest of the daily notes. It’s just $9/month and you get everything I do here. Check out the about page here for more. 10% of your subscription goes to charitable organizations such as Samaritan’s Purse, a Christian humanitarian aid organization.


