MLB Daily Notes: Friday, July 29
Introduction / Explanations for New Readers
Yesterday morning I was inspired to create a minor league stat dashboard, and 24 hours later, I have done it. The people in this “industry” who say “you can’t do it all” clearly don’t know Python, which is a top five invention in human history. I’m putting it up there with the automobile.
During my time in fantasy baseball, I have very intentionally not paid attention to the minor leagues, because I’ve always thought that the time is better spent on Major League data, and minor league numbers so rarely translate to the Majors, so it’s weird to even look at them. But, of course, there is something to being aware of minors leaguers - and THE PEOPLE certainly love that stuff, so I’m happy to now announce that I am the #1 fantasy baseball prospect analyst in the world.
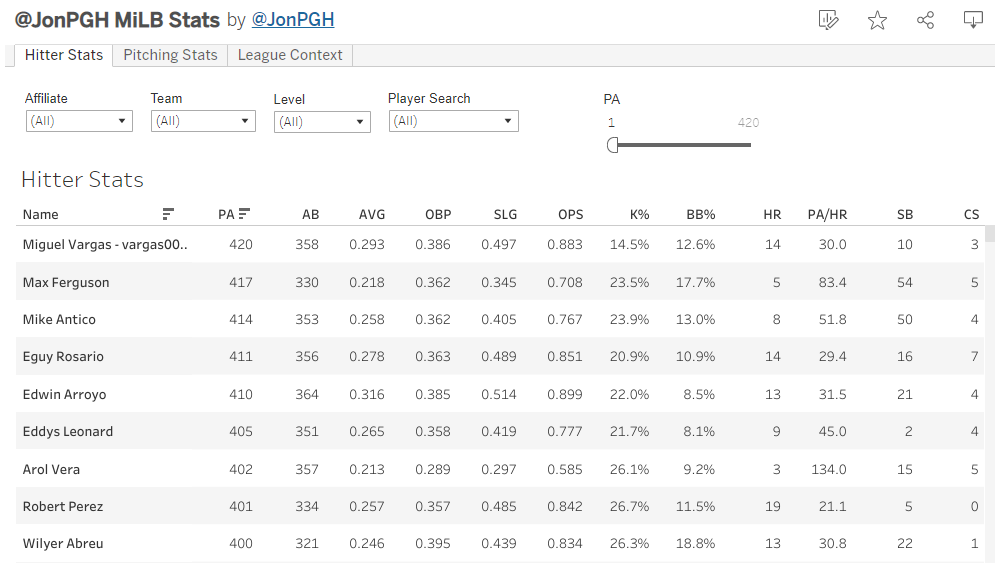
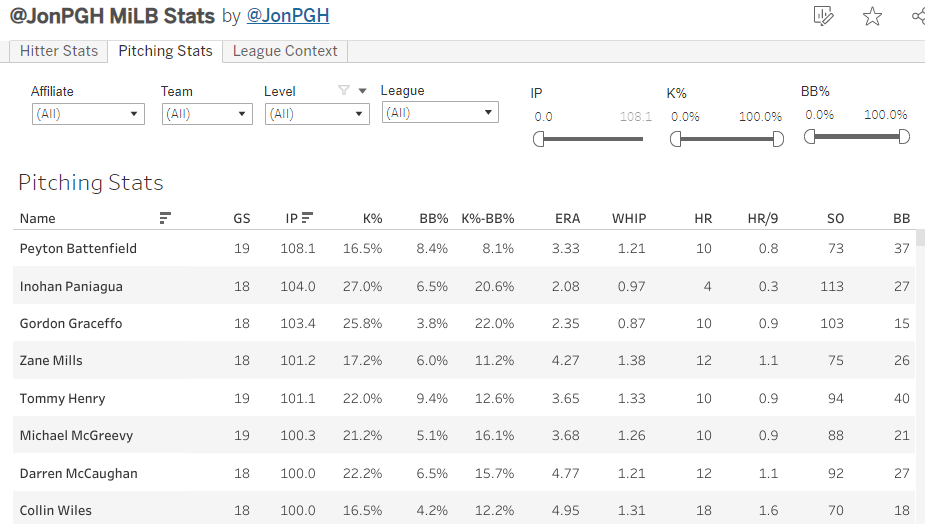
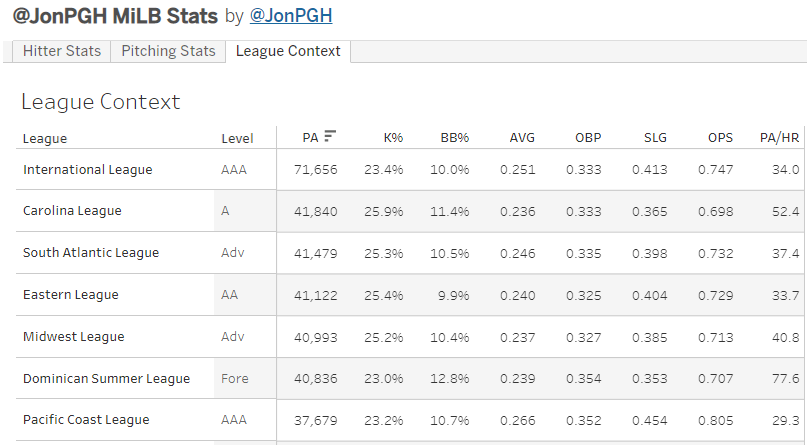
We have hitters and pitcher stats, filterable by Major League team, minor league team, league, and level. There’s always a handy tab for “League Context” which gives the league stats so you can weigh those in. Here are some screenshots
It’s somewhat limited right now because statcast doesn’t exist for most minor league teams, and I only have season-long box score data to use. The game logs are available for scraping through an API, and eventually, I will get this working game-by-game so we can do date filters and more stuff like that - but for now, it’s just raw boring stats there. I hope to have this thing really tuned up and humming next season.
It is only available to paid subscribers because I have reeled enough of you suckers in to start bleeding you dry. You’re going to be so pissed to find out all the stuff I put behind a paywall next year, but at least you can feel good knowing that most of your money will go towards feeding and clothing my three children. So even if you hate me personally (understandable…), you could justify it yourself to just imagine that the money will go towards my kids having a comfortable life and maybe even someday escaping the Christian worldview and country music indoctrination I am putting on them with no remorse.
I drank just two $2 beers at the South Bend Cubs game last night, so shout out to me for the #moderation. I had a Miller Lite first and then I found a stand with Yuengling Black and Tan, so that was a nice changeup.
South Bend is an interesting place, and I was reminded of how little I get out of the house these days. The people around us were much more interesting than the game itself. People really love the 50:50 raffle, which is good because they raise money for a good cause - but I think people get more into it for the gambling aspect rather than the charity. And yo that’s a 50% rake. You won’t find a 50% rake anywhere else but a 50:50 raffle, I mean go to a casino they only take like 15%.
Brady Singer went big for the second straight start, this time against the Yankees! He struck out ten over seven innings giving up just one hit, getting 14 whiffs, and giving up just two fly-balls. He had a 38.4% CSW% and a 14.1% SwStr%.
That’s three straight starts with 10+ whiffs. In his last three starts:
34.9% CSW%
13.8% SwStr%
38.4% K%
11.0% BB%
.175 AVG
.190 SLG
He is the JA model’s #5 SP in July. I was pretty interested in him early on this year because he was putting up some great K-BB% marks, and now he’s back to it - although this time it’s more about a high K% rather than a low BB%.
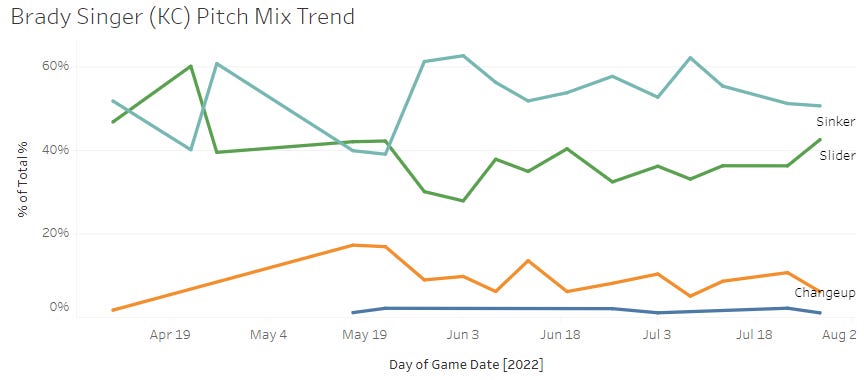
The question to ask now is: has anything changed in his profile recently? The answer for pitch mix is no:
This screenshot is from the “P Usage” tab on the dashboard, which I have just made better by changing the format and finally getting the data to be percentages rather than total pitches thrown.
So you can see no real changes there, still sinker-slider with some changeups and an occasional (accidental?) four-seamer. No velocity changes to speak of either, so maybe just an improvement in location - or maybe just total randomness where three of his good starts got clustered together by chance!
Probably add him if you need an SP just in case this isn’t noise, but I’m not making any promises here.
This is an interesting point to make. For every game a baseball player plays, they have some percent chance of having a good game. The percentages for each player are wildly different depending on their talent level and that game’s environment, but some unknown percentage does exist.
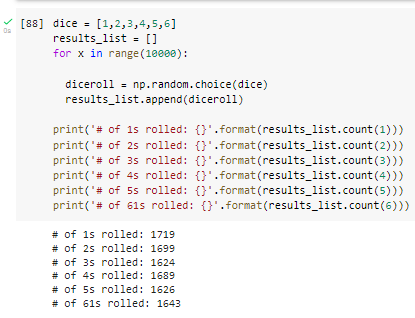
If you roll a dice, you have a one out of six chance to roll a six. If you roll the dice 10,000 times, you can feel pretty good that the percent of the time you get a six will be right around that 17%. I did this in Python to prove it, not that it needed proved, but Python is fun:
But if you look at any random sequence of 12 rolls, you are quite unlikely to see just two sixes in that sequence. You’ll have plenty of times where you roll three or four sixes in a row, and plenty of times where you’ll roll it 15 times in a row without getting a six.
We fall into this trap all of the time by looking at recent data samples and explaining a good or bad streak by saying there’s some change in the player’s ability. That happens sometimes, sure, but more often than not it’s just the result of some of these random chances being clustered together, like rolling sixes.
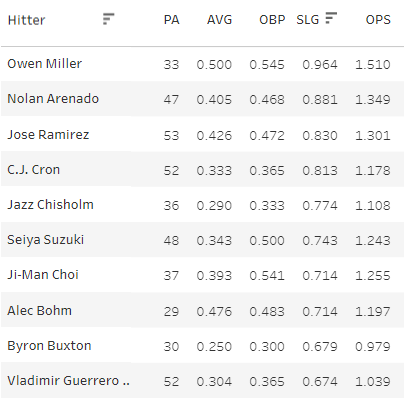
Remember at the beginning of the year when we all scurried out to add Owen Miller? On April 21st, here’s what you would’ve seen on the Dashboard:
Yeah, Owen Miller led the league in SLG in late April. Since it was a fresh season, his lucky 33 plate appearances made up 100% of his sample and those were the numbers we saw for the year - so everybody noticed it, and plenty of people went out to get him just in case he was suddenly a great hitter. Owen Miller’s season line is now .246/.299/.365.
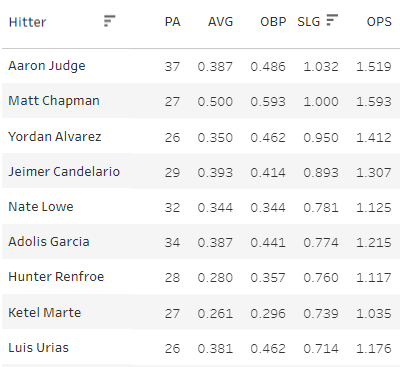
We could do this every day, and in fact we kinda do in these notes, but here are the SLG leaders from the last week:
If this were the beginning of the season everybody would be rushing to add Jeimer Candelario, saying this is the big breakout year - he’s finally found the power swing! We’d be claiming that Matt Chapman is back to being a top five 3B with his new team! We’d probably even be claiming that Aaron Judge is about to hit 39 homers in less than four months (wait a second…).
Randomness is real, and it has a much bigger influence on life than we like to think and give it credit for. There is a really high chance that Brady Singer is still just a mediocre fantasy pitcher that by good fortune put together three of his best starts of the year all in a row.
Kutter Crawford continues to look better than expected, as he had a nice outing yesterday with a 30.4% CSW%, but a mediocre 11.6% SwStr%. His numbers aren’t all that great on the yar, but the 25.3% K% - 7.6% BB% is encouraging, but the ground-balls just don’t exist with him at 28.8%.
The cold hitters report gets put to the test here as Trey Mancini and Ryan Mountcastle are both on the list, but they are in Cincinnati for a weekend set. Offensive production has been easy to come by in Cincy, so let’s see if they bust right out of that - or if they’re TRULY COLD.
CSW% Leaders - Yesterday
1. Brady Singer (KC): 14.1 SwStr%, 38.4 CSW%
2. Shohei Ohtani (LAA): 21.4 SwStr%, 34.7 CSW%
3. Ryan Yarbrough (TB): 18.1 SwStr%, 31.3 CSW%
4. Yusei Kikuchi (TOR): 14.9 SwStr%, 31.3 CSW%
5. Zack Wheeler (PHI): 10.3 SwStr%, 30.9 CSW%
6. Kutter Crawford (BOS): 11.6 SwStr%, 30.4 CSW%
7. Spencer Howard (TEX): 5.3 SwStr%, 28.9 CSW%
8. Jameson Taillon (NYY): 11.2 SwStr%, 28.6 CSW%
9. Triston McKenzie (CLE): 15.4 SwStr%, 28.6 CSW%
10. Justin Steele (CHC): 11.9 SwStr%, 28.6 CSW%
Top Pitcher JA Scores - Yesterday
1. Brady Singer - 7.0 IP - 84.75 JA Points
2. Shohei Ohtani - 6.0 IP - 81.5 JA Points
3. Ryan Yarbrough - 6.0 IP - 70.0 JA Points
4. Jameson Taillon - 6.0 IP - 52.5 JA Points
5. Spencer Howard - 5.0 IP - 47.5 JA Points
6. Triston McKenzie - 7.0 IP - 45.0 JA Points
7. Tyler Anderson - 7.0 IP - 43.25 JA Points
8. Justin Steele - 3.67 IP - 40.5 JA Points
9. Yusei Kikuchi - 5.0 IP - 38.75 JA Points
10. Graham Ashcraft - 6.67 IP - 37.25 JA Points
Pitcher JA Scores - Season
1. Spencer Strider (ATL) - 11 GS - 55.25 JA Points
2. Corbin Burnes (MIL) - 20 GS - 54.82 JA Points
3. Shane McClanahan (TB) - 19 GS - 54.7 JA Points
4. Shohei Ohtani (LAA) - 17 GS - 54.11 JA Points
5. Dylan Cease (CWS) - 20 GS - 52.34 JA Points
6. Brandon Woodruff (MIL) - 14 GS - 49.71 JA Points
7. Gerrit Cole (NYY) - 20 GS - 47.83 JA Points
8. Carlos Rodon (SF) - 20 GS - 47.75 JA Points
9. Max Scherzer (NYM) - 13 GS - 47.75 JA Points
10. Cristian Javier (HOU) - 15 GS - 45.68 JA Points
Velo Changes - Yesterday
Shohei Ohtani's SL velo (50 pitches) UP 2.1mph to 87.1
Jordan Lyles's SL velo (26 pitches) UP 2.0mph to 82.0
Brady Singer's SL velo (42 pitches) UP 1.8mph to 87.2
Shohei Ohtani's FS velo (14 pitches) UP 1.7mph to 91.0
Logan Gilbert's SL velo (33 pitches) DOWN -1.5mph to 85.8
Yusei Kikuchi's SL velo (14 pitches) DOWN -1.5mph to 85.4
Tyler Anderson's CH velo (33 pitches) DOWN -1.6mph to 77.6
Pitch Mix Changes - Yesterday
Alex Wood's SL usage (44.6%) up 10.0 points
Graham Ashcraft's SI usage (30.0%) up 11.5 points
Jordan Lyles's FF usage (50.9%) up 18.4 points
Jose Urena's SL usage (30.6%) up 12.5 points
Jose Urquidy's FF usage (72.6%) up 13.8 points
Logan Gilbert's SL usage (33.7%) up 10.0 points
Ryan Yarbrough's FC usage (61.4%) up 29.0 points
Shohei Ohtani's SL usage (51.0%) up 17.6 points
Zack Wheeler's FF usage (58.8%) up 19.2 points
CSW% Leaders - Last 3 Weeks
Shohei Ohtani - 75 TBF, 38.0% CSW%
Gerrit Cole - 77 TBF, 35.7% CSW%
Kyle Wright - 82 TBF, 35.5% CSW%
Max Scherzer - 105 TBF, 35.4% CSW%
Brandon Woodruff - 75 TBF, 34.9% CSW%
Carlos Rodon - 104 TBF, 34.7% CSW%
Aaron Nola - 83 TBF, 34.6% CSW%
Aaron Ashby - 77 TBF, 34.6% CSW%
Jose Berrios - 75 TBF, 34.2% CSW%
Dylan Cease - 73 TBF, 34.0% CSW%
K% Leaders - Last 3 Weeks
Shohei Ohtani - 75 TBF, 45.3% K%
Gerrit Cole - 77 TBF, 37.7% K%
Jose Berrios - 75 TBF, 36.0% K%
Corbin Burnes - 74 TBF, 35.1% K%
Carlos Rodon - 104 TBF, 34.6% K%
Brady Singer - 99 TBF, 33.3% K%
Sandy Alcantara - 79 TBF, 32.9% K%
Kevin Gausman - 67 TBF, 32.8% K%
Braxton Garrett - 89 TBF, 32.6% K%
Max Scherzer - 105 TBF, 32.4% K%
K-BB% Leaders - Last 3 Weeks
Shohei Ohtani - 75 TBF, 41.3% K-BB%
Gerrit Cole - 77 TBF, 33.8% K-BB%
Jose Berrios - 75 TBF, 32.0% K-BB%
Max Scherzer - 105 TBF, 28.6% K-BB%
Corbin Burnes - 74 TBF, 28.4% K-BB%
Kevin Gausman - 67 TBF, 28.4% K-BB%
Braxton Garrett - 89 TBF, 27.0% K-BB%
Clayton Kershaw - 74 TBF, 27.0% K-BB%
Yu Darvish - 109 TBF, 26.6% K-BB%
Aaron Nola - 83 TBF, 26.5% K-BB%
GB% Leaders - Last 3 Weeks
Framber Valdez - 87 TBF, 67.7% GB%
Carlos Carrasco - 67 TBF, 64.6% GB%
Logan Webb - 99 TBF, 62.9% GB%
Alex Wood - 86 TBF, 60.7% GB%
Justin Steele - 67 TBF, 60.4% GB%
Nathan Eovaldi - 67 TBF, 60.0% GB%
Kyle Freeland - 71 TBF, 59.6% GB%
Graham Ashcraft - 77 TBF, 57.7% GB%
Brad Keller - 72 TBF, 57.1% GB%
Sandy Alcantara - 79 TBF, 56.5% GB%
Magic Formula Qualifiers - Pitchers - Last 3 Weeks
Aaron Nola - 83 TBF, 28.9 K%, 2.4 BB%, 47.4% GB%
Alex Wood - 86 TBF, 27.9 K%, 5.8 BB%, 60.7% GB%
Clayton Kershaw - 74 TBF, 29.7 K%, 2.7 BB%, 56.0% GB%
Robbie Ray - 65 TBF, 29.2 K%, 3.1 BB%, 45.5% GB%
Sandy Alcantara - 79 TBF, 32.9 K%, 7.6 BB%, 56.5% GB%
Hot Pitcher Tracker - Last 3 Weeks vs. Career
Max Scherzer - +2.7% CSW%, -1.8 BB%
Aaron Nola - +2.1% CSW%, -2.4 BB%
Kyle Wright - +5.0% CSW%, -5.5 BB%
Gerrit Cole - +2.3% CSW%, -2.1 BB%
Merrill Kelly - +2.5% CSW%, -3.5 BB%
Shohei Ohtani - +6.2% CSW%, -3.7 BB%
Jose Berrios - +4.2% CSW%, -2.4 BB%
Mitch Keller - +3.9% CSW%, -7.6 BB%
Dylan Cease - +2.9% CSW%, -2.2 BB%
Dean Kremer - +3.2% CSW%, -2.9 BB%
Nestor Cortes - +2.4% CSW%, -4.4 BB%
Chris Bassitt - +4.7% CSW%, -2.3 BB%
Jaime Barria - +2.3% CSW%, -2.1 BB%
Spenser Watkins - +2.3% CSW%, -3.4 BB%
Multiple Barrels
Alex Bregman (HOU) 4 PA, 7 Swings, 2 Barrels, 1 HR
Willi Castro (DET) 4 PA, 9 Swings, 2 Barrels, 1 HR
Top Hitter JA Scores - Yesterday
1. Matt Chapman - 4.0 PA - 71.0 JA Points
2. Cal Mitchell - 4.0 PA - 46.0 JA Points
3. Corey Seager - 3.0 PA - 42.0 JA Points
4. Xander Bogaerts - 4.0 PA - 41.0 JA Points
5. Freddie Freeman - 5.0 PA - 41.0 JA Points
6. Alex Bregman - 4.0 PA - 40.0 JA Points
7. Zach McKinstry - 5.0 PA - 39.0 JA Points
8. Josh VanMeter - 4.0 PA - 38.0 JA Points
9. Jose Ramirez - 4.0 PA - 38.0 JA Points
10. Willi Castro - 4.0 PA - 37.0 JA Points
Hitter JA Scores - Season
1. Yordan Alvarez (HOU) - 338.0 PA - 156.45 JA Points
2. Aaron Judge (NYY) - 420.0 PA - 128.95 JA Points
3. Juan Soto (WSH) - 416.0 PA - 120.96 JA Points
4. Alejandro Kirk (TOR) - 329.0 PA - 119.88 JA Points
5. Freddie Freeman (LAD) - 433.0 PA - 118.06 JA Points
6. Paul Goldschmidt (STL) - 404.0 PA - 106.73 JA Points
7. Bryce Harper (PHI) - 271.0 PA - 104.21 JA Points
8. Jose Abreu (CWS) - 419.0 PA - 103.1 JA Points
9. D.J. LeMahieu (NYY) - 389.0 PA - 102.83 JA Points
10. Luis Arraez (MIN) - 363.0 PA - 102.48 JA Points
Hardest Hit Balls
Vinnie Pasquantino (KC) - 114.4mph - foul
Vladimir Guerrero Jr. (TOR) - 113.3mph - field_out
Vladimir Guerrero Jr. (TOR) - 113.3mph - field_out
Josh Naylor (CLE) - 113.0mph - double
Jonathan Schoop (DET) - 110.8mph - field_out
Carlos Santana (SEA) - 109.7mph - foul
Aaron Judge (NYY) - 109.6mph - home_run
Teoscar Hernandez (TOR) - 109.6mph - field_out
Kyle Schwarber (PHI) - 109.6mph - home_run
Brandon Drury (CIN) - 108.8mph - double
Last 3 Weeks - Brl% Leaders
Aaron Judge - 77 PA, 41 BIP, 13 Brls, 31.7 Brl%
Austin Riley - 69 PA, 52 BIP, 14 Brls, 26.9 Brl%
Bobby Dalbec - 54 PA, 27 BIP, 7 Brls, 25.9 Brl%
J.D. Martinez - 49 PA, 35 BIP, 8 Brls, 22.9 Brl%
Brandon Belt - 49 PA, 32 BIP, 7 Brls, 21.9 Brl%
Julio Rodriguez - 48 PA, 32 BIP, 7 Brls, 21.9 Brl%
Ramon Laureano - 71 PA, 45 BIP, 9 Brls, 20.0 Brl%
Matt Chapman - 59 PA, 31 BIP, 6 Brls, 19.4 Brl%
Luke Voit - 60 PA, 36 BIP, 7 Brls, 19.4 Brl%
Nolan Jones - 59 PA, 37 BIP, 7 Brls, 18.9 Brl%
Last 3 Weeks - xwOBA Leaders
Freddie Freeman - 68 PA, 0.543 xwOBA
Austin Riley - 69 PA, 0.525 xwOBA
Aaron Judge - 77 PA, 0.5 xwOBA
Alec Bohm - 49 PA, 0.479 xwOBA
Juan Soto - 65 PA, 0.446 xwOBA
Corey Seager - 70 PA, 0.443 xwOBA
Ketel Marte - 60 PA, 0.43 xwOBA
D.J. LeMahieu - 74 PA, 0.43 xwOBA
Kris Bryant - 59 PA, 0.424 xwOBA
Julio Rodriguez - 48 PA, 0.416 xwOBA
Last 3 Weeks - Contact% Leaders
Steven Kwan - 85 PA, 132 Swings, 93.9 Cont%
Myles Straw - 63 PA, 97 Swings, 93.8 Cont%
Bryson Stott - 58 PA, 110 Swings, 92.7 Cont%
Luis Arraez - 51 PA, 90 Swings, 91.1 Cont%
Isiah Kiner-Falefa - 58 PA, 98 Swings, 90.8 Cont%
J.P. Crawford - 61 PA, 107 Swings, 90.7 Cont%
Alec Bohm - 49 PA, 96 Swings, 90.6 Cont%
Mookie Betts - 78 PA, 140 Swings, 90.0 Cont%
Jose Ramirez - 72 PA, 138 Swings, 87.7 Cont%
Ty France - 62 PA, 121 Swings, 87.6 Cont%
Magic Formula Qualifiers - Hitters - Last 3 Weeks
Austin Riley - 69 PA, 18.8 K%, 26.9 Brl%
Corey Seager - 70 PA, 11.4 K%, 16.7 Brl%
Jorge Polanco - 56 PA, 17.9 K%, 15.2 Brl%
Ketel Marte - 60 PA, 10.0 K%, 17.0 Brl%
Manny Machado - 70 PA, 20.0 K%, 14.6 Brl%
Rowdy Tellez - 62 PA, 17.7 K%, 15.2 Brl%
Hot Hitter Tracker - Last 7 vs. Career
Jonathan India - +7.2% Contact%, +4.1 mph exit velo, -4.3 Chase%
Anthony Rizzo - +5.3% Contact%, +3.2 mph exit velo, -12.5 Chase%
Austin Riley - +9.7% Contact%, +5.3 mph exit velo, -11.0 Chase%
Yordan Alvarez - +5.4% Contact%, +4.6 mph exit velo, -13.9 Chase%
Pete Alonso - +10.1% Contact%, +6.7 mph exit velo, -9.2 Chase%
Super Ultra Mega Hot Hitters - Last 15 Days
Josh Bell - 0.454 xwOBA, 12.9% Brl%, 80.9% Contact%, 14.8% Chase%, 13.6% K%
Cold Hitters - Last 2 Weeks
Trey Mancini - 35.7% Whiff%, 80.8% Weak%, 0.964 Cold Rating
Nick Castellanos - 36.8% Whiff%, 71.4% Weak%, 0.908 Cold Rating
Austin Hays - 29.3% Whiff%, 76.0% Weak%, 0.862 Cold Rating
Jake Meyers - 30.8% Whiff%, 73.7% Weak%, 0.856 Cold Rating
Eugenio Suarez - 31.5% Whiff%, 72.7% Weak%, 0.852 Cold Rating
Michael Harris II - 31.6% Whiff%, 70.8% Weak%, 0.842 Cold Rating
Javier Baez - 32.1% Whiff%, 69.2% Weak%, 0.822 Cold Rating
Willy Adames - 28.2% Whiff%, 74.1% Weak%, 0.822 Cold Rating
Joey Votto - 35.5% Whiff%, 66.7% Weak%, 0.802 Cold Rating
Ryan Mountcastle - 28.7% Whiff%, 70.0% Weak%, 0.772 Cold Rating
Now to the paid stuff. For $7/month or $70/year you get access to a bunch of extra goodies, including, but not limited to
NFL Dashboards, Notes, Reports, Write-Ups, and Projections!!
Minor League Stat Dashboard!
Daily Projections (with DraftKings salaries & scores) Excel & a Tableau Dashboard)
Strikeout Prop Model Comparisons. Compares my K projection with FanDuel and DraftKings Sportsbook betting lines
My personal DraftKings player pools and cash lineups (not every day but when I have time!)
Daily hitter matchup ratings
Plate Discipline leaderboard
More Magic Formula Qualifiers
Pitch Mix and Velo Changes Tracker
Full daily and season-long pitcher and hitter data reports
Full access to my daily-updated algorithmic hitter and pitcher rankings
Offseason reviews & previews of every single fantasy-relevant player
More stuff added throughout the year as ideas come to me
Premium Features - SAMPLES
Here are some samples of what you get with the paid subscription, for anybody on the fence!
SAMPLE K Prop Comparison Sheet
SAMPLE JA Algorithm - Season Hitter Ranks
SAMPLE DraftKings Hitter Scoring Analysis
You get all of that updated daily (projections updated throughout the day as lineups come out) for just $7/month or $70/year - along with a ton more stuff.


