MLB Daily Notes - July 1st
A daily automated report of what happened yesterday in Major League Baseball, along with other recent trends and further analysis.
I am running a special until Tuesday. You can get a yearly subscription for $50, which is $30 cheaper than usual. That means you will get the rest of this season, the full off-season (draft prep!), and the first half of last season for just that $50.
Pitcher Review
What more can be said about Garrett Crochet? Let’s just update his stats and show where he ranks in the league among SPs with at least a dozen starts.
K%: 35.3% (1st)
K-BB%: 30.3% (1st)
K: 141 (1st)
Fantasy Points: 410 (1st)
ERA: 3.02 (18th)
WHIP: 0.93 (3rd)
SwStr%: 17.3% (1st)
Strike%: 52.8% (1st)
OPS Allowed: .570 (4th)
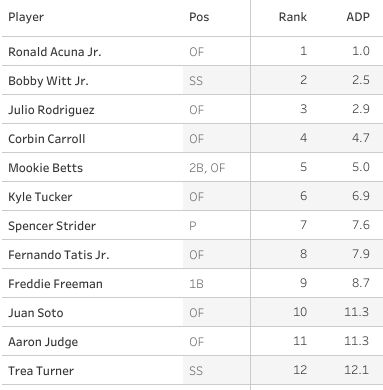
His NFBC ADP this year was in the 500s, so if you have this guy, you got him for free. Wild stuff. The whole first round was littered with traps.
The Acuna and Strider seasons are over, Turner missed several weeks with injury and Betts is in that boat now as well. J-Rod and Carroll have not been performing anywhere near expectations. The winners here have been Witt Jr., Tucker, Freeman, Soto, and Judge. If you picked late in the first round, you avoided a lot of that, and you’re probably doing a bit better right now. Shohei Ohtani was right around there as well. Aaron Judge now has 31 homers and 82 RBI.
2024 RBI Leaders
Judge 82
Ramirez 76
Bohm 68
Ozuna 67
Ohtani 62
Soto 61
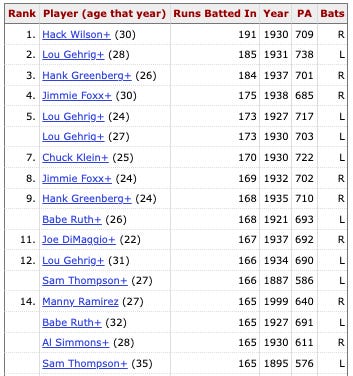
82 RBI is a lot for a full season and Judge still has three months to go. He’ll never catch our boy Hack Wilson, who drove in 191 runs in 1930. But if we’re sticking to the modern era, Manny Ramirez’s 1999 total of 165 looks not completely out of reach, although it’s really unlikely that Judge will continue anything near this pace.
Why am I writing this in the pitcher review section?
Andrew Heaney put on a show on Sunday Night Baseball.
7 IP, 5 H, 2 ER, 10 K, 0 BB, 20.4% SwStr%, 19 whiffs
Against the Orioles no less!
That brings his season ERA to 4.04 with a 23.3% K% and a 6.0% BB%. That’s an underrated pitcher. He is averaging about 5.5 innings per start, which isn’t great, but it is up from last year. The Rangers clearly needed rotation help this year, and they’ve gotten some of that by letting Heaney get deeper into games.
The fastball is slow, but it works fine, and the slider is a very good pitch for him.
I still view him as more of a streamer rather than someone you hold onto, but that’s dependent on league size. In a 14-teamer or deeper, he’s probably worth a start most times.
Taj Bradley lit up the Nats for 11 strikeouts. He generated 20 whiffs. That did cost him the quality start, as it took him 99 pitches to do all of that. The end line was awesome nonetheless:
5.2 IP, 3 H, 0 R, 11 K, 2 BB
He’s now at a sick 15% SwStr% with a fine 35.8% Ball%, which has turned into a 31.6% K% and 8.8% BB%.
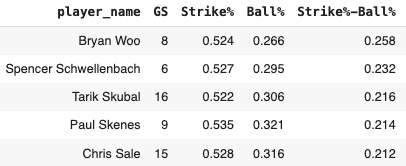
This gave me the idea to do a leaderboard of Strike%-Ball%, so the gap between strike rate and ball rate.
Strike%-Ball% Leaders
Skubal 21.6%
Skenes 21.4%
Sale 21.2%
Estes 20.8%
Crochet 20.3%
Kirby 20.1%
Houck 19.7%
Ryan 19.0%
Steele 18.2%
Jones 18.2%
So those are nine pitchers that have had very good fantasy seasons, and then Joey Estes.
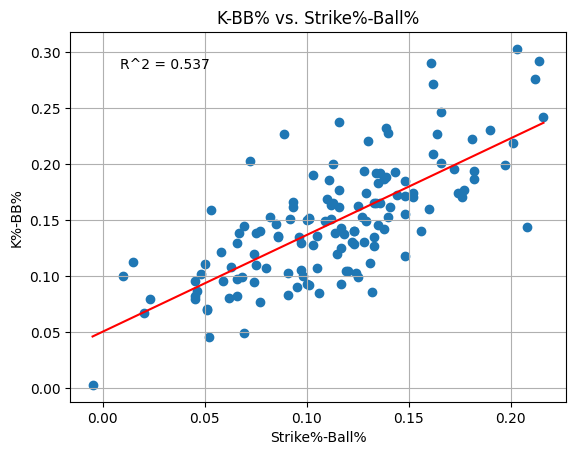
So it’s a useful leaderboard, but I guess I don’t know why we’d look at that when we have K-BB% available to us.
The two have a pretty strong correlation there. One thing we could maybe do is find the pitchers that have big differences in where they line up in these two categories. So we could see that Joey Estes ranks 4th in Strike-Ball% but 71st in K-BB%.
Given that most people are very close and the correlation is there, I would guess that these two numbers would tend to move toward each other. This means that 67 on Estes should come down as time passes. But that doesn’t help us really because it could happen in two ways. Maybe the K-BB% will come up (that would be good), or maybe the Strike-Ball% will come down (that would be bad). Which one drives the other? That is the question. Since Strike%-Ball% is more granular (measured at the pitch level) than K-BB% (measured at the batter faced level), I would pick that as the driver, meaning I’d predict Estes’ K-BB% to move up.
What we could do is go back to last year, find the guys that had these big differences at this point, and then see what happened in the second half of the year. The old backtesting method! Maybe I will do that this afternoon, but for now, this is the daily notes, and we need to get back to daily notes stuff.
Eight strikeouts for Brandon Pfaadt, whose rollercoaster ride continues.
What to say about Pfaadt? I don’t know at this point. The 16.2% K-BB% is a bit better than average. He’s about average at earning strikes (11.7% SwStr%, 47.1% Strike%), but he’s very good at not throwing balls (33% Ball%, 6% BB%). That means he allows a lot of balls in play, and that does subject him to the randomness of what happens when a ball is put in play.
Remember the fundamental idea here. Why do we like strikeouts? Because it gives the hitter a less than one percent chance to reach base (the dropped third strike rule makes it not quite zero). Any ball put in play gives the hitter a much higher chance of reaching base. This is the whole idea behind FIP, which stands for Fielding Independent Pitching. We want to try our best to evaluate a pitcher on the things he had the full control over. And the pitcher doesn’t have control of what happens after a ball comes off the bat into fair territory.
Spencer Schwellenbach wasn’t quite as good yesterday, but it was an 11:35 game so he obviously just wasn’t awake yet. Making these dudes play at 11:30 is weird and silly and they should stop all of these gimmicks. Roku will be fine, I have like three of their TVs, they’re doing fine.
5 IP, 5 H, 4 ER, 7 K, 2 BB, 11.8% SwStr%, 48.2% Strike%, 35.3% Ball%
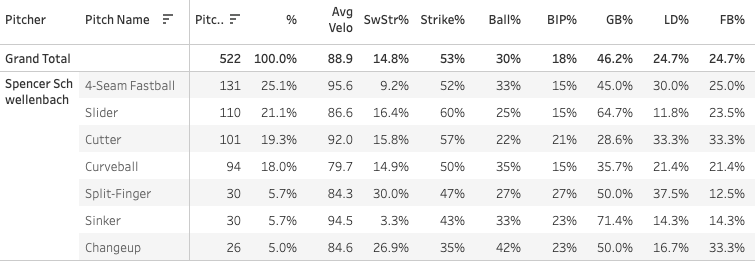
He is still very, very strong in our favorite stats with a 14.8% SwStr%, 53% Strike%, and 30% Ball%.
To bring back to what we discussed earlier, if we expand the Strike%-Ball% leaderboard to need just five starts to qualify, Schwelly would be #2.
My love affair with him continues, and I recommend that everybody pick him up.
Hitter Review
I never pay any attention to the Sunday Night game, but I missed some stuff last night - wow!
A 40-burger from Wyatt Langford.
He has 115 plate appearances since returning from the IL, and it looks like this:
.299/.348/.495, .843 OPS, 3 HR, 9% Brl%, 15.7% K%, 6.1% BB%, .323 xwOBA
He has raised his launch angle quite a bit since this IL stint.
Before: 88 BIP, 13.4 average LA, 12.5 median LA
After: 89 BIP, 19.7 average LA, 17.0 median LA
He has also raised his average exit velocity by two miles per hour, things are going very well. You probably should have figured he would improve as the season went on. Remember that his guy had all of 186 professional PAs before this year. He now has a .713 OPS, four homers, and seven steals in 245 PA.
Reader Questions
Would it be possible to automate a sendout that analyzes relievers who are at lower ownership percentages but have been getting opportunities lately and should be targeted in saves+holds leagues? I assume this would involve a combo of high k/9, being on a decent team (that puts them in holds positions somewhat regularly), low walk rate, low BABIP, etc. Basically wondering if you have any formulas to help target guys like Andres Munoz last year before the rest of the league catches on. ~ Chris
That is a very good idea, but it is hard for me to do. The data I use is pitch-by-pitch, so it has one row of data for every pitch thrown. That makes it tough to nail down saves and holds situations. I was going to go into the Python code to show this, but it’s hard even to explain why it’s hard. It’s possible with the right logic and coding, but it would take a good bit of effort on my part and would still have bugs.
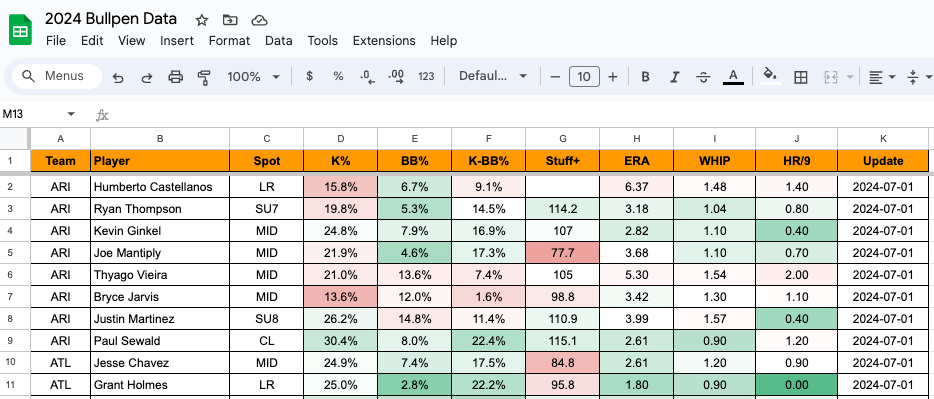
The best I have for you all right now is the 2024 Bullpen Data sheet. It scrapes FanGraphs (Roster Resource) daily to get the current bullpen situations, and it brings in some of our favorite stats for each guy.
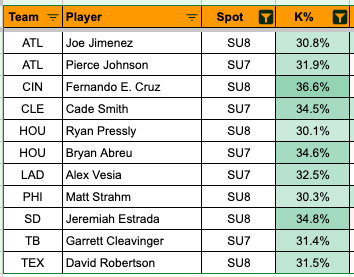
You could run a filter on that on “SU7” or “SU8” pitchers (that means setup 7th inning or setup 8th inning) and then look for high K% pitchers. Those names could be considered the “Next man up.”
Okay, I’ve got to get to some real-life stuff; I will be back later; I’ve got a few analysis pieces cooking. But no slate preview today because there are only three games today. Our patience will be rewarded the rest of this week if we get through today, as we’ll have full slates every day with Thursday being Independence Day.
Pitcher Reports
Algo SP Ranks - Yesterday
1. Garrett Crochet
2. Taj Bradley
3. Andrew Heaney
4. Lance Lynn
5. Hunter Greene
6. Joe Ryan
7. Seth Lugo
8. Freddy Peralta
9. Luis Medina
10. Brandon Pfaadt
11. Gerrit Cole
12. Luis Castillo
13. Casey Mize
14. Yonny Chirinos
15. Spencer Bivens
16. Bailey Falter
17. James Paxton
18. Spencer Schwellenbach
19. Patrick Corbin
20. Logan Allen
21. Kevin Gausman
22. Kyle Hendricks
23. Cole Irvin
24. Tyler Anderson
25. Josh Winckowski
26. Matt Waldron
27. Luis Severino
28. Kyle Freeland
29. Shawn Dubin
30. Ranger Suarez
Fantasy Points Leaders - Yesterday
1. Taj Bradley (vs. WSH): 35.76 Points
2. Seth Lugo (vs. CLE): 34.5 Points
3. Andrew Heaney (vs. BAL): 32.75 Points
4. Freddy Peralta (vs. CHC): 31.35 Points
5. Garrett Crochet (vs. COL): 30.75 Points
6. Lance Lynn (vs. CIN): 27.7 Points
7. Joe Ryan (vs. SEA): 27.16 Points
8. Brandon Pfaadt (vs. OAK): 23.3 Points
9. Gerrit Cole (vs. TOR): 22.85 Points
10. Bailey Falter (vs. ATL): 19.65 Points
Whiffs Leaders - Yesterday
1. Garrett Crochet (CWS): 24 Whiffs (88 Pitches)
2. Taj Bradley (TB): 20 Whiffs (99 Pitches)
3. Andrew Heaney (TEX): 19 Whiffs (93 Pitches)
4. Freddy Peralta (MIL): 18 Whiffs (103 Pitches)
5. Lance Lynn (STL): 17 Whiffs (79 Pitches)
6. Joe Ryan (MIN): 16 Whiffs (99 Pitches)
7. Hunter Greene (CIN): 16 Whiffs (95 Pitches)
8. Seth Lugo (KC): 16 Whiffs (93 Pitches)
9. Luis Medina (OAK): 14 Whiffs (86 Pitches)
10. Michael Soroka (CWS): 13 Whiffs (54 Pitches)
Strike% Leaders - Yesterday
1. Garrett Crochet (CWS): 61.4 Strike%, 21.6 Ball%
2. Joe Ryan (MIN): 58.6 Strike%, 26.3 Ball%
3. Taj Bradley (TB): 58.6 Strike%, 32.3 Ball%
4. Seth Lugo (KC): 58.1 Strike%, 29.0 Ball%
5. Gerrit Cole (NYY): 55.6 Strike%, 32.2 Ball%
6. Andrew Heaney (TEX): 54.8 Strike%, 26.9 Ball%
7. Lance Lynn (STL): 54.4 Strike%, 27.8 Ball%
8. Hunter Greene (CIN): 53.7 Strike%, 33.7 Ball%
9. Michael Soroka (CWS): 50.0 Strike%, 37.0 Ball%
10. Landen Roupp (SF): 49.2 Strike%, 37.3 Ball%
11. Brandon Pfaadt (ARI): 48.8 Strike%, 32.9 Ball%
12. Freddy Peralta (MIL): 48.5 Strike%, 36.9 Ball%
13. Spencer Schwellenbach (ATL): 48.2 Strike%, 35.3 Ball%
14. Bailey Falter (PIT): 48.1 Strike%, 39.5 Ball%
15. Luis Medina (OAK): 47.7 Strike%, 32.6 Ball%
Pitches/Out (POUT) Leaders - Yesterday
1. Luis Severino: 79 Pitches, 21 Outs, 3.76 POUT
2. Josh Winckowski: 58 Pitches, 15 Outs, 3.87 POUT
3. Spencer Bivens: 60 Pitches, 15 Outs, 4.0 POUT
4. Kyle Freeland: 80 Pitches, 20 Outs, 4.0 POUT
5. Garrett Crochet: 88 Pitches, 21 Outs, 4.19 POUT
6. Andrew Heaney: 93 Pitches, 22 Outs, 4.23 POUT
7. Lance Lynn: 79 Pitches, 18 Outs, 4.39 POUT
8. Michael Soroka: 54 Pitches, 12 Outs, 4.5 POUT
9. Brandon Pfaadt: 82 Pitches, 18 Outs, 4.56 POUT
10. Luis Medina: 86 Pitches, 18 Outs, 4.78 POUT
Velo Changes - Yesterday
Joe Ryan's FS velo (16 pitches) UP 3.0mph to 88.5
Andrew Heaney's SL velo (29 pitches) UP 2.1mph to 84.0
Kyle Freeland's SI velo (29 pitches) UP 1.8mph to 90.9
Brandon Pfaadt's CU velo (11 pitches) UP 1.7mph to 81.0
Luis Castillo's SL velo (17 pitches) UP 1.7mph to 87.6
Luis Medina's CU velo (11 pitches) UP 1.5mph to 81.4
Luis Medina's SL velo (23 pitches) UP 1.5mph to 86.8
Ranger Suarez's SI velo (23 pitches) DOWN -1.5mph to 90.4
Josh Winckowski's SI velo (18 pitches) DOWN -1.6mph to 94.3
Gerrit Cole's SL velo (12 pitches) DOWN -1.7mph to 87.4
Gerrit Cole's FC velo (18 pitches) DOWN -1.7mph to 90.8
James Paxton's CH velo (16 pitches) DOWN -1.8mph to 81.9
Ranger Suarez's CU velo (19 pitches) DOWN -1.9mph to 73.4
Ranger Suarez's CH velo (21 pitches) DOWN -2.8mph to 79.1
Yonny Chirinos's SL velo (36 pitches) DOWN -3.5mph to 84.5
Pitch Mix Changes - Yesterday
Bailey Falter's SL usage (37.0%) up 19.1 points
Casey Mize's SI usage (17.4%) up 10.4 points
Gerrit Cole's FC usage (20.0%) up 12.2 points
James Paxton's CU usage (41.6%) up 15.5 points
James Paxton's CH usage (18.0%) up 10.3 points
Joe Ryan's ST usage (27.3%) up 13.9 points
Josh Winckowski's FF usage (17.2%) up 12.7 points
Kyle Hendricks's CU usage (19.1%) up 12.9 points
Lance Lynn's FF usage (75.9%) up 21.3 points
Luis Severino's SI usage (63.3%) up 49.4 points
Matt Waldron's ST usage (25.7%) up 11.2 points
Michael Soroka's SL usage (59.3%) up 21.8 points
Patrick Corbin's FC usage (31.9%) up 26.2 points
Seth Lugo's CH usage (20.4%) up 13.5 points
Spencer Schwellenbach's SI usage (20.0%) up 14.0 points
Taj Bradley's FS usage (27.3%) up 16.8 points
Tyler Anderson's CH usage (45.5%) up 10.4 points
Yonny Chirinos's SL usage (41.4%) up 13.9 points
Yonny Chirinos's FF usage (14.9%) up 11.1 points
Become a paid sub today to get the rest of the daily notes. It’s just $9/month and you get everything I do here. Check out the about page here for more. 10% of your subscription goes to charitable organizations such as Samaritan’s Purse, a Christian humanitarian aid organization.


