MLB Daily Notes - June 11th
A daily automated report of what happened yesterday in Major League Baseball, along with other recent trends and further analysis.
My wife and I watch Top Chef after most of our long days with me typing numbers and her raising, encouraging, disciplining, nurturing, feeding, clothing and sustaining three other human lives, we both have it tough, I know. Last night the challenge was that the chefs had to feed a bunch of kids in their school’s cafeteria.
This one lady made Sherry-Braised chicken thighs, which was clearly an insanely dumb idea from the beginning. So yeah, she went home. But the episode inspired me and this morning I made my kids a nice three course breakfast of eggs, skinned and sliced apples, and waffles with just a small dab of syrup. I plated it all real nice and everything, it was beautiful. My five year old daughter ate most of it and liked it, so she’s my favorite. Trea Baby put his finger in the syrup, licked it, and then didn’t touch another bite.
So the question - do kids only like kids foods because they’re programmed that way, or is it because that’s just what they’re given early and often because adults think that’s what they’ll like? I imagine it’s the latter. I bet if right from jump street you started giving a kid like chicken breast, fruits, yogurt, rice, etc. then that’s what they’d like and if they ever saw a chicken nugget or a french fry they’d be like ew what the hell. I’d like someone to experiment on that, in fact I think I might have someone in mind. For me, it’s too late. You can’t put the toothpaste back in the tube, and you can’t make a two year old want apples and eggs for breakfast when you’ve already exposed them to syrup.
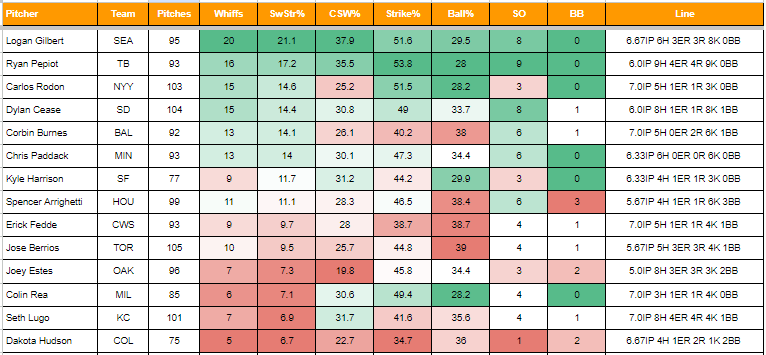
Given the short Monday slate, I can just give you the full shabang of yesterday’s SP data:
Joey This obviously broke my heart giving up the big old WHIP of 2. You never like a two WHIP, and the whiffs were putrid at a 7.3% SwStr%. Not good. This was the tougher matchup of the week, so I’m sticking with him for the weekend start against the Twins.
I really want someone to ask Corbin Burnes about his strikeouts. He is now at just a 24% K% on the year, that’s down more than ten points from what he did in 2021. And his xBA is .217 with a .344 xSLG with .269 xwOBA, he’s making it work beautifully and eating up a ton of innings. This has to be some kind of conscious decision, right?
He hasn’t changed the pitch mix since 2021, he still throws a ton of cutters. The difference is that the cutter had a 32% Whiff% in 2021 but now a 19.5% Whiff% this year. But apparently it doesn’t matter when you’re Corbin Burnes. I’m so shook by it that I’m going to do something I never do - share a FanGraphs screenshot:
30% K-BB% in 2021, 2.43 REA
24% K-BB% in 2022, 2.94 ERA
17% K-BB% in 2023, 3.39 ERA
18% K-BB% in 2024, 2.08 ERA
You can see the effect a lowering K-BB% has on the SIERA, as his 4.02 and 3.48 SIERAs these last two years would not make you think you’re looking at one of the league’s premier starters, but maybe Burnes has beaten the game. I don’t know.
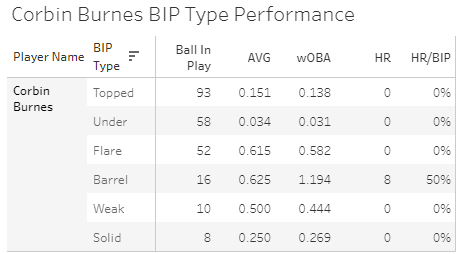
Here’s his BIP Type performance:
He’s allowing a batting average below the league average on everything but weak, and that’s only 10 BIP. The biggest thing here seems to be the 0.031 wOBA allowed on unders. The league allows a 0.073 wOBA on those, which still isn’t high, but Burnes has half of that. 63% of his balls in play are either under or topped, the league is at 57%. So he’s getting the right types of balls in play and outs are being made on them.
I drafted Burnes in my home league and like four weeks in traded him for Aaron Judge because I noticed the strikeouts were not coming back up from last year. That trade has obviously worked out for me, but not because the Burnes regression hit - it’s just because Aaron Judge has been Barry Bonds ever since the day I got him.
The only reason to not call Burnes a sell-high guy right now would be if you think he’s a true outlier. And maybe he is. There’s stuff I don’t know. His .249 BABIP is low, but not like egregiously low, and he’s done that for the last three years (.259, .244, .249).
If you’re telling me you could get Logan Gilbert and Christian Walker for him or something like that, I’d probably do it.
Chris Paddack did what he was supposed to with 6.1 shutout innings of the Road Rockies. He didn’t walk anybody and finally had some normal luck on balls in play. Most interesting was that the velo bump stuck around:
He faces the Athletics this weekend so you should pick him up for that start if he’s available, and I still think there might be some hope for him as a useful fantasy starter for the rest of the year - especially if this fastball velo is going to be around 95 now.
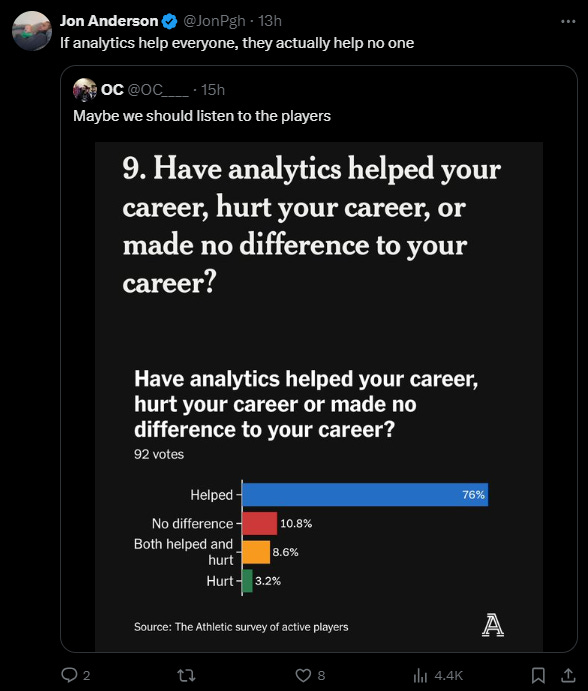
This reminds me of a tweet I sent last night that I wanted to expound on.
Changing your game based on analytics only works if some of your competition isn’t doing that. It’s kind of a catch-22. The first hitter to figure out that pulling fly balls was a huge advantage had a … huge advantage. They’d be out there pulling their fly balls while other people weren’t, and that made them look better than other hitters. But once everybody figures that out, then the advantage goes away. Not only do other hitters start doing what you’re doing, thereby reducing the distance between you and them, but pitchers also figure it out and adjust in order to stop you from doing that.
It’s all a giant moving target, a game of adjustments and changes.
The main point here is that if 100% of players say analytics have helped their careers, a ton of them are wrong because they’re just doing the stuff that everybody else is doing.
Now the real explanation here is probably that analytics helped them get to the Major Leagues in the first place. That’s a different, most complicated story, and it’s probably true. But again, if every minor leaguer has the same analytics, then it just goes right back to physical skill in being able to get your body to do what it needs to do with the analytics in mind.
It’s like when people trying to be motivational tell girls that they’re beautiful no matter what. That’s a logical impossibility. If everybody is beautiful, then nobody is beautiful. Beauty is defined by comparison.
It’s also why we will never get rid of poverty. Wealth isn’t defined by a dollar amount, but by the difference between what you have and what everybody else has. If you gave everybody in the world $1,000,000, nothing would change. Rich people would still be just as rich and poor people would still be just as poor because the entire economy would adjust to fit the new monetary distribution.
“The poor you will always have with you” (Mark 14:7)
I don’t know if Jesus was thinking of wealth distributions and economic factors when He said that, but yeah we’re never getting rid of poverty, and in the same way, analytics must continue to change in order to be of use to anybody.
That doesn’t mean that we should stop helping the poor (this is the best use of charitable donations in my opinion - feed and clothe people that need it), and it doesn’t mean we should stop using analytics.
Some standout OPS of the last three weeks:
Teoscar Hernandez 1.043
Nolan Gorman 1.032
Heliot Ramos 1.012
Ryan Mountcastle .983
Matt Vierling .968
Anthony Santander .945
Ezequiel Tovar .931
Masyn Winn .903
Ian Happ .903
Jonathan India .895
Jeimer Candelario .892
Nick Gonzales .885
Teoscar Hernandez is quite underrated, but yeah the Dodger Blue has made a big difference for him. He has a 16% Brl% and a 29% K%, and he’s turned that into 16 homers in 282 PAs, an elite 17.6 PA/HR rate. The 51% hard hit rate is amazing as well.
Heliot Ramos is another hitter I missed. I don’t even think I’ve really mentioned him here yet, and it’s probably too late. He’s now at .318/.400/.527 with six homers, a 15% Brl%, a 58% hard hit rate, but a 29.6% K%. Before his call-up he was hitting .296/.388/.565 with eight homers and a 27.6% K% in AAA. Last year he slashed .303/.384/.570 with a 24.8% K% and a homer every 20 PAs in the minors, so he’s been mashing for awhile now. I have doubts that any hitter can maintain a .500+ SLG with a strikeout rate near 30%, and I have special doubts when that hitter is a rookie - but he is worth the add now just in case he’s still available. Just don’t hold on too tight if things start going south and that K% stays high.
Nolan Gorman is the Blake Snell of hitters. If you drafted him, your idea should have just been to start him every week and don’t look at the numbers. He was always going to give you horrible stretches and elite stretches, and he’s on one of those elite stretches right now.
Masyn Winn and Ian Happ also may be available in your leagues. Neither of those names will be game-changers for you, but I think they’ll both be solid if not boring contributors in roto. They can do a bit of everything and the contact ability keeps their floors pretty high.
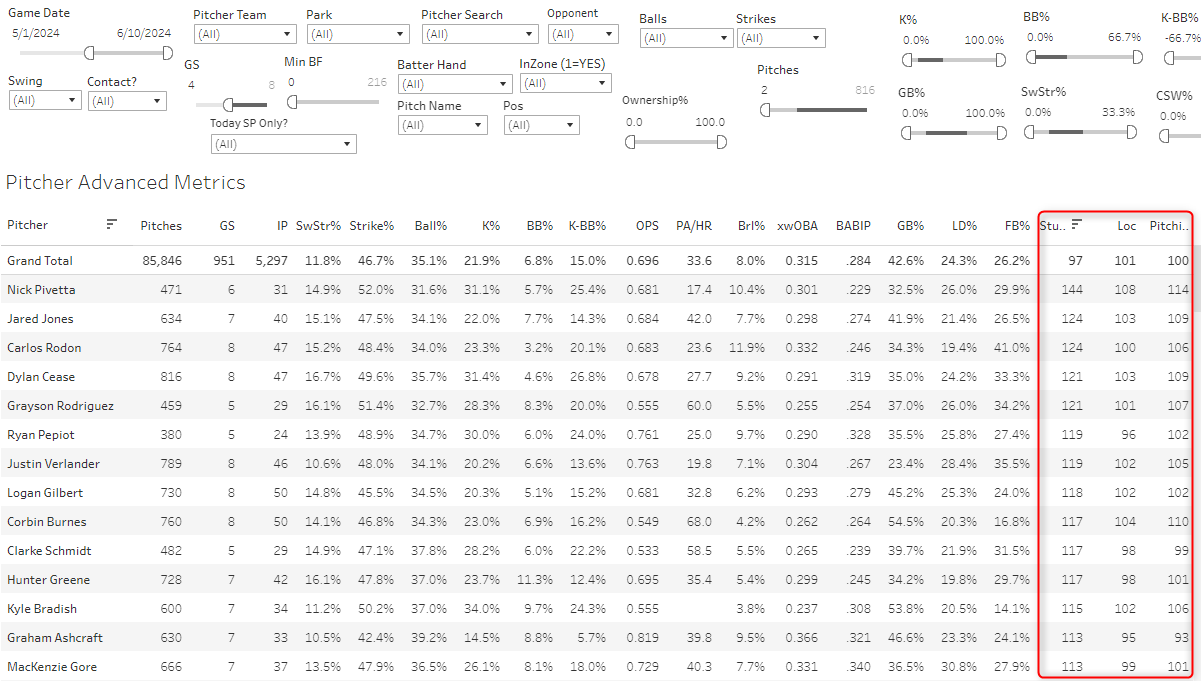
One more thing! As mentioned before, Drew Haugen has selfishly abandoned MLB Data Warehouse for an internship with the “Philadelphia Phillies”. He was my Stuff+ provider, but I guess he thinks a Major League organization can offer him better future employment opportunities than a 33-year-old dude with a blog in a basement, so I have taken matters into my own hands. I have figured out how to scrape FanGraphs Stuff+ daily. So it’s not at the pitch-by-pitch level like it was with Drew, but it’s at the day level, so now the main dashboard will show you the Stuff+, Location+, and Pitching+ over any data sample:
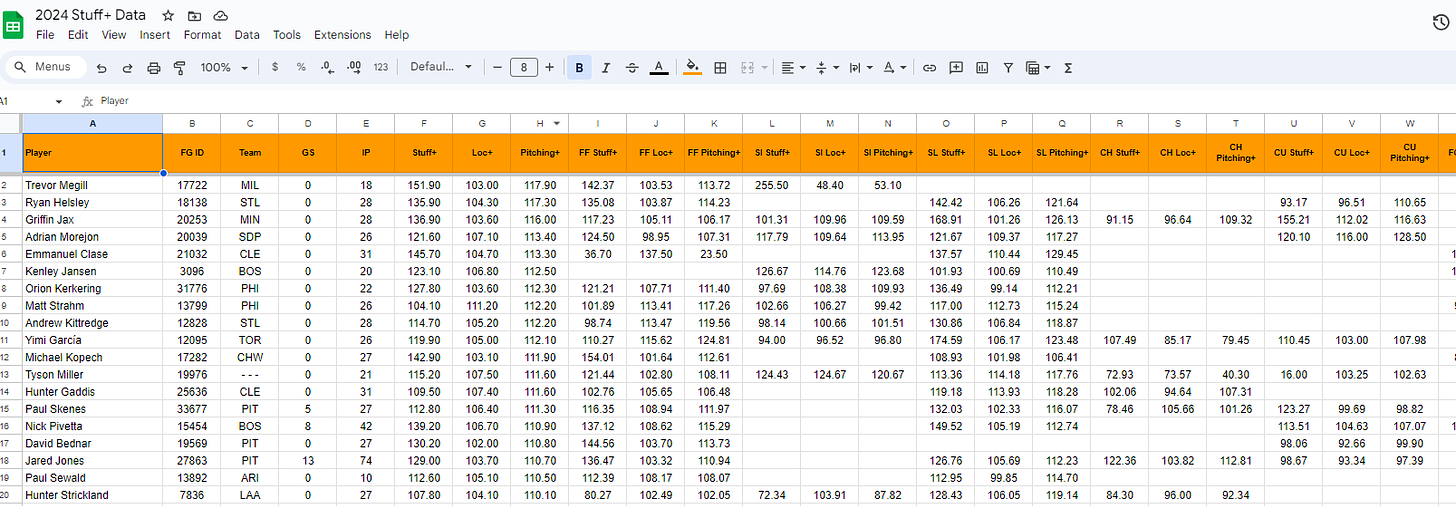
For now, it will typically be one day late, and I don’t have it on there at the individual pitch level. The pitch level stuff for the whole season is available on the 2024 Stuff+ Google Sheet if you’re really looking for that and don’t want to go to FanGraphs.
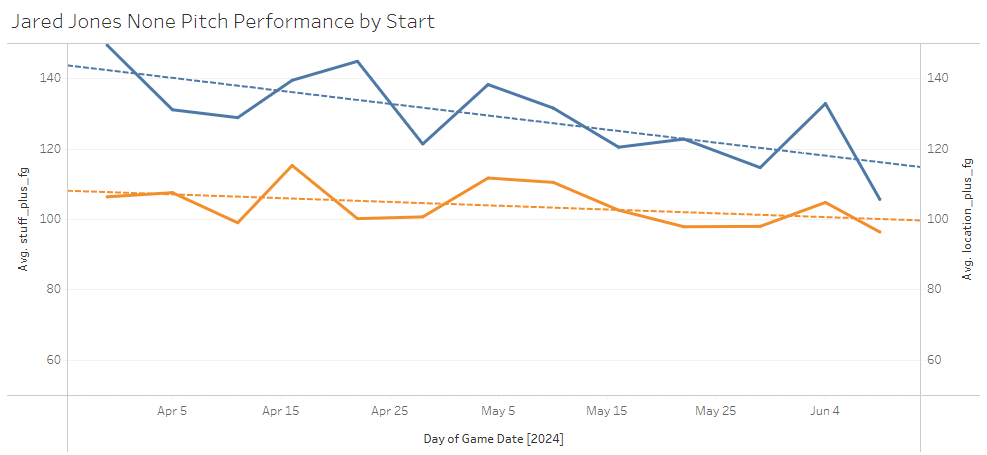
I’ve also updated the “Stuff by Game” tab of the main dashboard to use the new data:
I totally just chose Jared Jones randomly and not because I just traded him away after seeing this downtrend.
But that’s a pretty cool chart if you’re looking for trends for an individual pitcher.
The numbers on the main tab may not exactly match what you’re seeing on FanGraphs even though it is the same data. That is because the average of averages is not always the correct average. So for a quick stats lesson here.
Pitcher A throws 100 pitches on June 4th with a Stuff+ of 110
Pitcher A throws 80 pitches on June 11th with a Stuff+ of 90
My script will take the 110 and 90 and get the average - 100. That’s not the truth though because the pitch counts were different. The real answer is actually 101.1 because more pitches were thrown at the 110 average than the 90 average.
But as long as the pitch counts for a guy are relatively steady, you’ll get the right number or a number that is just a point or two off.
That all probably didn’t need to be said, I don’t have too many readers trying to fact-check my numbers, but just in case, just in case.
It’s good to have that data back. I think eventually I’ll get it to the pitch level, but that will require some mappings and some extra math and whatnot that I just didn’t want to get into yesterday.
Onward to the automation and to the rest of another busy day for myself.
Pitcher Reports
Algo SP Ranks - Yesterday
1. Logan Gilbert
2. Carlos Rodon
3. Ryan Pepiot
4. Dylan Cease
5. Chris Paddack
6. Kyle Harrison
7. Spencer Arrighetti
8. Corbin Burnes
9. Colin Rea
10. Jose Berrios
11. Joey Estes
12. Erick Fedde
13. Seth Lugo
14. Dakota Hudson
Fantasy Points Leaders - Yesterday
1. Corbin Burnes (vs. TB): 28.15 Points
2. Chris Paddack (vs. COL): 26.64 Points
3. Dylan Cease (vs. OAK): 26.1 Points
4. Colin Rea (vs. TOR): 23.95 Points
5. Logan Gilbert (vs. CWS): 21.41 Points
6. Carlos Rodon (vs. KC): 20.75 Points
7. Spencer Arrighetti (vs. SF): 18.56 Points
8. Erick Fedde (vs. SEA): 18.15 Points
9. Ryan Pepiot (vs. BAL): 18.1 Points
10. Kyle Harrison (vs. HOU): 15.84 Points
Whiffs Leaders - Yesterday
1. Logan Gilbert (SEA): 20 Whiffs (95 Pitches)
2. Ryan Pepiot (TB): 16 Whiffs (93 Pitches)
3. Carlos Rodon (NYY): 15 Whiffs (103 Pitches)
4. Dylan Cease (SD): 15 Whiffs (104 Pitches)
5. Chris Paddack (MIN): 13 Whiffs (93 Pitches)
6. Corbin Burnes (BAL): 13 Whiffs (92 Pitches)
7. Spencer Arrighetti (HOU): 11 Whiffs (99 Pitches)
8. Jose Berrios (TOR): 10 Whiffs (105 Pitches)
9. Erick Fedde (CWS): 9 Whiffs (93 Pitches)
10. Kyle Harrison (SF): 9 Whiffs (77 Pitches)
Strike% Leaders - Yesterday
1. Ryan Pepiot (TB): 53.8 Strike%, 28.0 Ball%
2. Logan Gilbert (SEA): 51.6 Strike%, 29.5 Ball%
3. Carlos Rodon (NYY): 51.5 Strike%, 28.2 Ball%
4. Colin Rea (MIL): 49.4 Strike%, 28.2 Ball%
5. Dylan Cease (SD): 49.0 Strike%, 33.7 Ball%
6. Chris Paddack (MIN): 47.3 Strike%, 34.4 Ball%
7. Spencer Arrighetti (HOU): 46.5 Strike%, 38.4 Ball%
8. Joey Estes (OAK): 45.8 Strike%, 34.4 Ball%
9. Jose Berrios (TOR): 44.8 Strike%, 39.0 Ball%
10. Kyle Harrison (SF): 44.2 Strike%, 29.9 Ball%
11. Seth Lugo (KC): 41.6 Strike%, 35.6 Ball%
12. Corbin Burnes (BAL): 40.2 Strike%, 38.0 Ball%
13. Erick Fedde (CWS): 38.7 Strike%, 38.7 Ball%
14. Dakota Hudson (COL): 34.7 Strike%, 36.0 Ball%
Pitches/Out (POUT) Leaders - Yesterday
1. Dakota Hudson: 75 Pitches, 20 Outs, 3.75 POUT
2. Colin Rea: 85 Pitches, 21 Outs, 4.05 POUT
3. Kyle Harrison: 77 Pitches, 19 Outs, 4.05 POUT
4. Corbin Burnes: 92 Pitches, 21 Outs, 4.38 POUT
5. Erick Fedde: 93 Pitches, 21 Outs, 4.43 POUT
6. Logan Gilbert: 95 Pitches, 20 Outs, 4.75 POUT
7. Chris Paddack: 93 Pitches, 19 Outs, 4.89 POUT
8. Carlos Rodon: 103 Pitches, 21 Outs, 4.9 POUT
9. Seth Lugo: 101 Pitches, 20 Outs, 5.05 POUT
10. Ryan Pepiot: 93 Pitches, 18 Outs, 5.17 POUT
Become a paid sub today to get the rest of the daily notes. It’s just $9/month and you get absolutely everything that I do here. Check out the about page here for more. 10% of your subscription goes to charitable organizations such as Samaritan’s Purse, a Christian humanitarian aid organization.


