Every once in a while, I’ll get the hankering to get into a really competitive dynasty league or two. I was watching my guys, Tim Kanak and Doc Eisenhauer talk about some prospects last night and I got that urge. Check that out here, they are two of my favorite guys in the fantasy baseball space.
The dynasty urge usually goes away, but who knows, maybe I’ll take the plunge this offseason. An MLB Data Warehouse dynasty league could be a fun thing to start up. But I’d probably want to actually vet the people looking to join. Being the commissioner of a dynasty league seems like hell, having to constantly replace people who quit or just don’t manage their teams.
One of the guys they talked about there was Jonah Tong. And he’s a little bit more interesting now since it looks like Griffin Canning will be out for a long time. Tong is a Mets pitching prospect with a 1.88 ERA, a 0.91 WHIP, a 41% K%, and an 11.5% BB% in the minors this year. He is doing all of this in AA, which makes it pretty unlikely that he gets a call this year.
There’s also a question about child labor laws and how those work in New York. The Mets are claiming this guy is 22 years old, but honestly, he looks closer to 12.
I know a lot of you are probably about to pick up the phone and start calling the authorities about possible exploitation here. But you don’t have to do that, I’m on the case. I looked at more pictures of the guy, and he doesn’t always look this young. There are also no credible allegations about an athlete lying about their age in this direction. Juan Soto might be 57 right now, I’ll admit that, but if Tong was going to lie it he would be saying he’s actually younger than he is, not older.
After looking more into it, I realized that I’ve seen this guy before. Because he has a pretty funky delivery, he’s super over-the-top.
That’s interesting. The AA numbers are incredible, and he’s someone to watch and surely roster in the dynasty leagues that are out there.
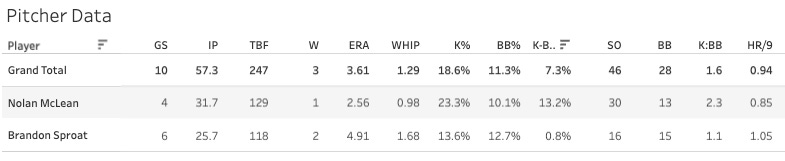
But more likely, we’ll see either Nolan McLean or Brandon Sproat get the call. Here’s what they’ve done this year in AAA:
Sproat has been a disaster, what in the world! COME ON. I drafted this guy a couple of times on NFBC.
Last year, he went for a 28.3% K% and a 9.1% BB%, but then this year he loses 12 points on the K% and adds two points to the BB%. Real nice.
Nolan McLean’s numbers are much better, but still not very good with the 13.2% K-BB% and 23% K%. Let’s get into the advanced business (AAA numbers only):
Both guys can get ground balls, which is good, but the K-BB% keeps their JA ERA (read: SIERA) very poor. If it is one of those two they call up, it would be tough for me to recommend them being added in fantasy leagues.
I think they should just go ahead and take the Tongs out of the drawer baby, let’s go for it. Who needs AAA? Get your best guy Tong up there and see what he does. I think kids get to run the bases after the games on Sundays, so that could be extra fun for Jonah!
I’m starting to slightly wonder if these daily notes are getting close to being too widely read for me to justify making jokes like I do. At some point, I should probably chill out. I mean, I’ve already chilled out on a few things, but I should consider chilling out even more. But we’re going to keep it moving here. I don’t really think Juan Soto is nearing Social Security eligibility. It’s all jokes.
Someone in our Discord mentioned Taylor Ward’s home/road splits. So that made me think it might be fun/interesting to see the biggest home/road split differences of the year. This is at least like 75% randomness with such a small sample size, so don’t take it very seriously.
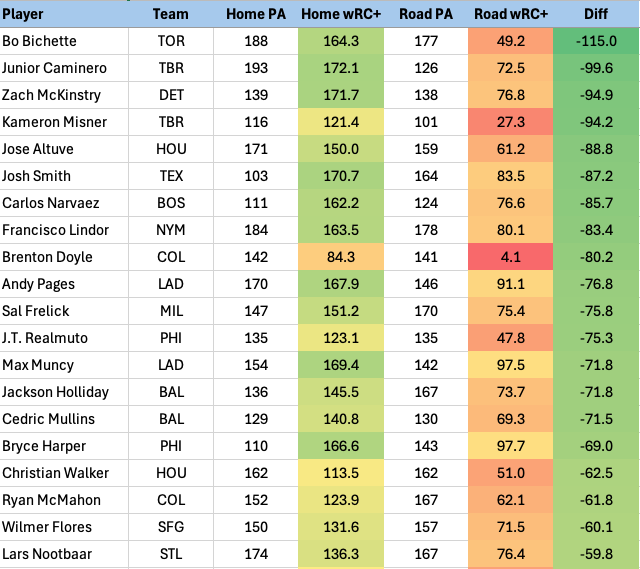
Here are the guys with the biggest split in favor of their home games.
Bichette has a .923 OPS at home and a .536 mark on the road.
Caminero has 13 of his 20 homers at home with a .597 SLG at home and just .400 on the road.
It makes sense that Caminero would do better at home. You should always put this stuff into the ballpark context in your head. Some guys, you would expect pretty significant splits (Caminero), some guys who play in pretty neutral home ballparks, you wouldn’t expect that (Bichette). But it’s possible. Maybe Bichette just sees the ball really well at home because his eyes are used to the backdrop or something.
And in general terms, you do expect hitters to perform a bit better at home. I took the average of the sample here (I required 100 PAs both on the road and at home to study) and found this:
Hitters at Home: 112 wRC+
Hitters on Road: 108 wRC+
The reason they’re both well above the league average (100 wRC+) is that minimum PA requirement. I filtered out a ton of the bad hitters in the league who aren’t good enough play enough to qualify here. But you can see the four-point difference there.
What does that have to do with? I’m not sure. The ballpark stuff cancels out, so it’s not that. It probably just has to do with the comfort of usual surroundings. You probably sleep a little better when you’re in your own bed. The opposing pitchers are probably a little bit worse since they’re in uncommon bullpens and dugouts and hotels and whatever. Interesting stuff.
Here’s the data the other way around, the hitters who have excelled much more on the road:
So we see Taylor Ward there, as one of my readers spotted. But the biggest difference belongs to Dillon Dingler.
Again, this is all mostly random. But we do see some of the guys in those tough home ballparks like Dinger (DET), Witt (KC), Garcia (KC), and Pasquantino (KC). Although, didn’t the Royals do way better at home last year? I thought I remembered being suspicious about what they were doing at home… HMMMMMMMMMMM!
Let me check.
2024
Royals at home: .260/.317/.420
Royals on road: .236/.288/.388
2025
Royals at home: .236/.281/.330
Royals on road: .250/.302/.397
They were way better at home last year, and now they’re way better on the road this year.
Human beings like to have an explanation for everything. We’re uncomfortable with the unknown or the unexplained. Because of that, we end up assuming that nefarious things are happening when they aren’t. Most of the time, randomness rules, and weird stuff happens for no particular reason you can point to.
That isn’t to say that there are no conspiracies or cheaters or people with their fingers on the scales. It’s just to say that that doesn’t happen nearly as often as some people like to think.
I saw yesterday that the NBA is going to use ARTIFICIAL INTELLIGENCE to try to find out why they have SEVEN Achilles tears this year after they didn’t have any last year. And who knows, maybe they’ll find something. Maybe there really is an explanation there. But I think it’s pretty likely that it’s just a random occurrence. Zero and seven are small numbers. And two season is a small sample.
It doesn’t hurt to look into it. Although, that’s not always true. Sometimes, by looking into things, you end up coming out with a false explanation just because you’re so desperate for an explanation. And, depending on what the explanation is, you can end up instituting some “fix” that actually makes things worse.
It’s like getting screened for diseases that you have no symptoms of. I read about this in a book once. It was like just getting routine breast cancer screenings or something. It’s actually not as good of an idea as it sounds like, because of the existence of false positives. There’s some percentage of screenings that give a false positive. Even if the rate of that is like 0.5%, it only takes 200 people to get screened for one of them to be told they have breast cancer when they actually don’t.
There have been cases of people then taking severe actions after getting that false positive, or they just end up adding a completely unnecessary burden or stress on their lives.
I’m not saying never get screened for stuff, I’m sure that idea would make plenty of people angry. I’m saying that if you’re going to get a test for something you have no really good reason to believe you have, do the test at least twice. Check things two or three times, and then you won’t have to worry about the possibility of a false positive.
But I don’t think anybody has any use for my advice about this kind of stuff. I just thought that the general concept was interesting.
Our boy Dietrich Enns had a really nice outing. I did not realize how old that guy was. I wrote about him yesterday as if he were a prospect. But no, he was drafted by the Yankees back in 2012. This guy is my age!
And yesterday wasn’t even his Major League debut. Far from it! He made a couple of appearances for the Twins in 2017 and then again for the Rays in 2021.
So this is a pretty cool story, I suppose. The guy has been grinding in the minor leagues for a really long time. But who knows, maybe he can hang around on the Major League roster for the Tigers this year. He’s been great in the minors and looked sharp yesterday:
5 IP, 1 H, 0 R, 4 K, 2 BB, 16.9% SwStr%, 28.6% Ball%
The pitch mix:
The fastball and changeup were dominant. This was against a pretty subpar Athletics lineup in Detroit, so the environment was nice for him. But you don’t see too many guys grabbing seven whiffs on 37 four-seamers thrown.
Knowing his age and history better now will raise the bar quite a ways for me to think he should be owned in fantasy leagues. It’s also quite, quite possible that he’s back in AAA tomorrow. I doubt the Tigers view him as a part of their Major League unit. But shoutout to Dietrich Enns. You’ve now accomplished the alluring achievement of being talked about in the daily notes. Which is way more cool and impressive than winning a game in the Major Leagues.
Shota Imanaga threw 77 pitches in his return to the Majors. He gave up just one hit and no runs on a 3:1 K:BB. He’s an everyday starter in fantasy leagues, but I do want to remind some people that he hasn’t looked all that impressive under the hood this year.
The K% should come up, I think? The 13.3% SwStr% would suggest a 25-27% K%, but he’s at just 18.7%. But he hasn’t looked like a high K guy overall in his MLB career. He has a 22.9% K% in his last 21 starts dating back to last year’s All Star Break. He’s giving up another super high FB% at 38%, and yet he’s benefited thus far from a low 13% HR/FB.
Maybe that’s just a skill of his, to generate weak fly balls. But I have my doubts about that. I think he’s a lot riskier than people will assume when they see his career 2.70 ERA and 1.02 WHIP. If he’s going to be a 20% K% guy with a 35%+ FB%, that’s going to turn into some really rough outings when the variance doesn’t go his way.
Shane Baz popped off.
8 IP, 3 H, 0 ER, 9 SO, 1 BB
What a strange guy. And since I’m in the business of face analysis today, I can say that he’s a bit strange in that arena as well.
Just a tough day to take a headshot, I think. You don’t see many white mustaches. I didn’t even really know that was possible for a 26-year-old. Is it dyed? It’s all very confusing. Is it possible that Jonah Tong is actually 12, and he took those ten years from Shane Baz, who is actually 36? Even 36 though, you shouldn’t have gray hair yet, right?
I don’t know what to say about the Bazinator. He looked elite for five starts, and then looked completely awful for about six starts, and then it’s been a mix of both for the last five starts.
The advanced stats by month:
I do see some pitch mix changes here. He scrapped the slider on June 5th, and he added a cutdaddy on June 15th. Since that 6/15 start:
32% cutter usage! He’s throwing 68% fastballs, but the cutter has been marvelous with a 16.3% SwStr% and a 51% Strike% on a .203 xwOBA.
Maybe ‘marvelous’ is too bold a word. The root there is marvel, which means to be filled with wonder or astonishment.
The cutter does not fill me wonder or astonishment. But maybe that’s not fair, because I haven’t actually seen it thrown. I’m only seeing numbers. Let’s give this a shot. I will clear my mind, watch this pitch, and then see what kind of emotions and feelings fill me.
I am unfilled.
He has a 3.44 JA ERA, a 15.4% K-BB%, and a .290 xwOBA allowed in these last three starts. That seems to me to be a guy who is about a league-average (ish) starter who is on a good and somewhat lucky run now.
But it will always be a little more interesting when guys improve after adding a new pitch, and that is what we’ve seen from Baz in June.
Kevin Gausman had the elite start that we knew was coming.
Just when you think the guy is cooked, he drops a 30-burger. Just when you think he’s an ace, he goes below zero. You just can’t know what Gausman is going to give you. And shout out to me, I’ve been telling you all season long that I have no idea what Gausman will do from week to week. I am so good at telling you guys that I don’t know what is going to happen.
Another big day for Agustin Ramirez. He homered again and added two more hits to score 28 DraftKings points (led the day).
The season update:
.247/.294/.466, 17.4% K%, 6.4% BB%, 10.6% Brl%, .286 xBA, .360 xwOBA
It’s an impressive line. He has a dozen homers in 235 PAs, that’s a very good home run rate. He continues to hit the ball hard (109.2 EV90) and make a good amount of contact (87% Zone Contact%). That’s a special skillset, and I think this guy is going to be a very, very good Major League hitter. In fantasy leagues right now, I’d just be starting him every week. He’ll have down weeks, as we’ve seen, but I do think the net result will be very positive.
Rafael Devers hit his second dinger as a Giant. He’s hit .257/.350/.486 in his first 40 PAs with his new team.
It’s not like Devers was on a true MVP pace, but interleague trades are kind of goofy. Imagine he was the front-runner for MVP prior to the trade. Getting moved to a team in the other league immediately takes you out of the MVP discussion.
I am guessing that at least a few guys have not won an MVP award that they would’ve otherwise won because of a trade. Nobody comes to mind, but it’s probably happened. This would apply to the Cy Young as well.
Having separate awards for the different leagues doesn’t make as much sense anymore. It made a lot of sense before 1997 or whenever they began interleague play. And it still made some sense while the leagues had different rules (DH), but now with the leagues being exactly the same and playing each other more and more each year, it really doesn’t make sense anymore.
Nobody benefits from the awards being cut in half, though. So I don’t know what my idea would be to change it.
I do remember being a kid and being really intrigued by interleague play. My memory is that the Pirates would play one or two interleague series a year. And for some reason, I got really hyped about that. The rarity of it made it intriguing. That’s another rule of life: things that don’t happen very often are more interesting. It’s kind of like when Tommy Pham gets a hit.
If we’re going for full evenness and fairness, I’d say that we should get rid of divisions and leagues entirely. Mister Manfred, tear down these walls!
The world is such a different place now as compared to when MLB really got going. I’m no aviation expert, but I’m pretty sure that widespread availability of commercial flight didn’t really happen until the 50s or so. Maybe I should fact-check myself on that.
Check that out!
You couldn’t ask the New York Yankees to play the San Francisco Giants back then. And that’s for two reasons.
→ The drive would take several days
→ The San Francisco Giants didn’t even exist
I looked at the 1945 MLB standings:
Boston and St. Louis are pretty freaking far away. I mean, that’s more than a day's drive.
So how did they do that? I guess they just didn’t play nearly as frequently.
What am I even talking about here? I legitimately have to scroll up to even find out what got me here. Ah yes, getting rid of division and leagues.
That’s completely and totally feasible right now. It would still cost the teams a little more in travel expenses, since most of the divisions are still mostly geographically close. But money and travel time is no longer a problem for MLB.
Eventually, we’ll get there. I’d imagine that there’s no such thing as the National and American League in like 50 years.
I’ve gotta wrap it here. We’re traveling this weekend. My wife is throwing her sister a baby shower, so it’s a whole ordeal. We’re staying in a hotel with the three kids, and that’s the first time we’ll be doing that. It will be interesting. I’m not exactly sure what my wife and I are supposed to do when the kids are asleep in the hotel room at like 9pm. I guess just sit there and read a book quietly. And then what do we do when the kids are wide awake at 6:30 am? Just watch TV for as long as we can take that, I guess, and spend a lot of time at the hotel’s breakfast.
But I’m guessing the daily notes will be very abbreviated tomorrow and Sunday. Which is probably okay after the mess I’ve dropped on you here.
1. Dietrich Enns
2. Cristopher Sanchez
3. Hunter Brown
4. Kevin Gausman
5. Tanner Bibee
6. Grant Holmes
7. Shane Baz
8. Simeon Woods Richardson
9. Shota Imanaga
10. Janson Junk
11. Andre Pallante
12. Austin Gomber
13. Clayton Kershaw
14. Michael Lorenzen
15. Hayden Birdsong
16. Emerson Hancock
17. Jeffrey Springs
1. Shane Baz (vs. KC): 37.6 Points
2. Kevin Gausman (vs. CLE): 32.2 Points
3. Hunter Brown (vs. PHI): 31.95 Points
4. Cristopher Sanchez (vs. HOU): 30.5 Points
5. Simeon Woods Richardson (vs. SEA): 25.45 Points
6. Clayton Kershaw (vs. COL): 23.7 Points
7. Tanner Bibee (vs. TOR): 21.7 Points
8. Dietrich Enns (vs. ATH): 21.45 Points
9. Shota Imanaga (vs. STL): 20.05 Points
10. Bryan Abreu (vs. PHI): 14.99 Points
1. Cristopher Sanchez (PHI): 18 Whiffs (99 Pitches)
2. Grant Holmes (ATL): 17 Whiffs (97 Pitches)
3. Tanner Bibee (CLE): 17 Whiffs (96 Pitches)
4. Hunter Brown (HOU): 16 Whiffs (96 Pitches)
5. Kevin Gausman (TOR): 15 Whiffs (104 Pitches)
6. Dietrich Enns (DET): 13 Whiffs (77 Pitches)
7. Andre Pallante (STL): 12 Whiffs (94 Pitches)
8. Shane Baz (TB): 11 Whiffs (97 Pitches)
9. Simeon Woods Richardson (MIN): 9 Whiffs (82 Pitches)
10. Bryan Abreu (HOU): 8 Whiffs (22 Pitches)
1. Cristopher Sanchez (PHI): 57.6 Strike%, 30.3 Ball%
2. Dietrich Enns (DET): 57.1 Strike%, 28.6 Ball%
3. Kevin Gausman (TOR): 54.8 Strike%, 26.0 Ball%
4. Simeon Woods Richardson (MIN): 53.7 Strike%, 32.9 Ball%
5. Shane Baz (TB): 53.6 Strike%, 28.9 Ball%
6. Janson Junk (MIA): 53.4 Strike%, 21.9 Ball%
7. Tanner Bibee (CLE): 50.0 Strike%, 34.4 Ball%
8. Hunter Brown (HOU): 49.0 Strike%, 36.5 Ball%
9. Shota Imanaga (CHC): 46.8 Strike%, 36.4 Ball%
10. Grant Holmes (ATL): 44.3 Strike%, 40.2 Ball%
11. Austin Gomber (COL): 44.2 Strike%, 33.8 Ball%
12. Emerson Hancock (SEA): 44.0 Strike%, 36.9 Ball%
13. Jeffrey Springs (OAK): 42.7 Strike%, 39.3 Ball%
14. Michael Lorenzen (KC): 39.5 Strike%, 35.8 Ball%
15. Clayton Kershaw (LAD): 39.1 Strike%, 40.6 Ball%
1. Clayton Kershaw: 69 Pitches, 18 Outs, 3.83 POUT
2. Shane Baz: 97 Pitches, 24 Outs, 4.04 POUT
3. Kevin Gausman: 104 Pitches, 24 Outs, 4.33 POUT
4. Hunter Brown: 96 Pitches, 21 Outs, 4.57 POUT
5. Tanner Bibee: 96 Pitches, 19 Outs, 5.05 POUT
6. Michael Lorenzen: 81 Pitches, 16 Outs, 5.06 POUT
7. Dietrich Enns: 77 Pitches, 15 Outs, 5.13 POUT
8. Austin Gomber: 77 Pitches, 15 Outs, 5.13 POUT
9. Shota Imanaga: 77 Pitches, 15 Outs, 5.13 POUT
10. Simeon Woods Richardson: 82 Pitches, 15 Outs, 5.47 POUT
Emerson Hancock's SI velo (40 pitches) UP 1.5mph to 95.4
Austin Gomber's FS usage (16.9%) up 15.9 points
Emerson Hancock's SI usage (47.6%) up 13.1 points
Grant Holmes's FC usage (21.6%) up 11.7 points
Hayden Birdsong's FF usage (69.7%) up 17.0 points
Hunter Brown's CU usage (26.0%) up 12.1 points
Michael Lorenzen's FC usage (25.9%) up 15.6 points
Shane Baz's FC usage (40.2%) up 37.6 points
Tanner Bibee's SI usage (22.9%) up 17.5 points
Kumar Rocker Slider: -36.8%
Kumar Rocker Cutter: +36.0%
Jacob Lopez Changeup: +19.8%
Max Fried Cutter: +19.7%
Gavin Williams Cutter: +19.6%
Brayan Bello Cutter: +19.1%
Max Fried 4-Seam Fastball: -18.9%
Gavin Williams 4-Seam Fastball: -18.5%
Chase Dollander 4-Seam Fastball: -18.3%
JP Sears Sweeper: -17.5%
Jacob Lopez 4-Seam Fastball: -17.1%
Colin Rea 4-Seam Fastball: -16.9%
Yusei Kikuchi Curveball: +16.8%
Carson Palmquist Sinker: -14.9%
Michael Lorenzen Sinker: +14.8%
Bailey Falter Split-Finger: +14.8%
Tanner Bibee 4-Seam Fastball: -14.7%
Luis L. Ortiz Sinker: +14.6%
Bailey Falter Sinker: -14.6%
Mitchell Parker Curveball: +14.4%
Michael Lorenzen 4-Seam Fastball: -14.4%
Paul Skenes Split-Finger: -14.1%
Trevor Williams 4-Seam Fastball: +14.0%
Sean Burke Curveball: +13.6%
Chad Patrick Cutter: -13.4%
German Marquez Curveball: +13.3%
JP Sears Sinker: +13.2%
Merrill Kelly Cutter: +12.8%
Gavin Williams Sweeper: -12.5%
Carson Palmquist Cutter: +12.3%
Chase Dollander Cutter: -12.3%
Shane Baz 4-Seam Fastball: -12.1%
Mitchell Parker Split-Finger: -12.1%
Jose Soriano - 78 TBF, 37.1% CSW%
Spencer Strider - 92 TBF, 35.9% CSW%
Grant Holmes - 96 TBF, 35.2% CSW%
Cristopher Sanchez - 107 TBF, 34.0% CSW%
Jacob Lopez - 92 TBF, 33.9% CSW%
Luis L. Ortiz - 75 TBF, 33.8% CSW%
Hunter Brown - 69 TBF, 33.8% CSW%
Jack Flaherty - 89 TBF, 33.0% CSW%
Will Warren - 95 TBF, 32.6% CSW%
Ryan Pepiot - 73 TBF, 32.5% CSW%
Ryan Pepiot - 73 TBF, 37.0% K%
Spencer Strider - 92 TBF, 37.0% K%
Grant Holmes - 96 TBF, 36.5% K%
Hunter Brown - 69 TBF, 36.2% K%
Jose Soriano - 78 TBF, 35.9% K%
Yusei Kikuchi - 101 TBF, 35.6% K%
Zack Wheeler - 90 TBF, 35.6% K%
Michael Soroka - 92 TBF, 33.7% K%
Garrett Crochet - 104 TBF, 32.7% K%
Ryan Gusto - 69 TBF, 31.9% K%
Hunter Brown - 69 TBF, 31.9% K-BB%
Yusei Kikuchi - 101 TBF, 31.7% K-BB%
Ryan Gusto - 69 TBF, 29.0% K-BB%
Ryan Pepiot - 73 TBF, 28.8% K-BB%
Jose Soriano - 78 TBF, 28.2% K-BB%
Garrett Crochet - 104 TBF, 27.9% K-BB%
Zack Wheeler - 90 TBF, 27.8% K-BB%
Spencer Strider - 92 TBF, 27.2% K-BB%
Jacob deGrom - 93 TBF, 26.9% K-BB%
Cristopher Sanchez - 107 TBF, 25.2% K-BB%
Jose Soriano - 78 TBF, 68.2% GB%
Framber Valdez - 79 TBF, 66.0% GB%
Andre Pallante - 91 TBF, 65.7% GB%
Hunter Brown - 69 TBF, 59.0% GB%
Bryce Elder - 75 TBF, 58.8% GB%
Brayan Bello - 77 TBF, 58.5% GB%
Adrian Houser - 76 TBF, 57.1% GB%
Max Fried - 106 TBF, 56.8% GB%
David Peterson - 79 TBF, 56.7% GB%
Jack Kochanowicz - 75 TBF, 56.6% GB%
Aaron Ashby - 47 TBF, 29.8 K%, 2.1 BB%, 64.5% GB%
Chris Sale - 59 TBF, 30.5 K%, 5.1 BB%, 50.0% GB%
Cristopher Sanchez - 107 TBF, 27.1 K%, 1.9 BB%, 54.1% GB%
Garrett Crochet - 104 TBF, 32.7 K%, 4.8 BB%, 54.7% GB%
Hunter Brown - 69 TBF, 36.2 K%, 4.3 BB%, 59.0% GB%
Jose Soriano - 78 TBF, 35.9 K%, 7.7 BB%, 68.2% GB%
Logan Webb - 102 TBF, 28.4 K%, 5.9 BB%, 43.3% GB%
Yusei Kikuchi - 101 TBF, 35.6 K%, 4.0 BB%, 44.3% GB%
Cristopher Sanchez - +3.8% CSW%, -3.8 BB%
Tanner Bibee - +2.8% CSW%, -4.0 BB%
Ranger Suarez - +2.3% CSW%, -1.6 BB%
Yusei Kikuchi - +2.7% CSW%, -3.2 BB%
Andre Pallante - +3.2% CSW%, -2.4 BB%
Jose Soriano - +7.9% CSW%, -2.5 BB%
Will Warren - +2.5% CSW%, -5.2 BB%
Hunter Brown - +5.1% CSW%, -3.7 BB%
Eric Lauer - +4.4% CSW%, -2.1 BB%
Agustin Ramirez (MIA) 5 PA, 6 Swings, 2 Barrels, 1 HR
Daniel Schneemann (CLE) 3 PA, 6 Swings, 2 Barrels, 0 HR
Pete Alonso (NYM) 4 PA, 6 Swings, 2 Barrels, 0 HR
Agustin Ramirez (MIA) - 113.0mph - double
Jac Caglianone (KC) - 112.5mph - nan
Pete Alonso (NYM) - 112.4mph - double
Carlos Correa (MIN) - 111.4mph - single
Rafael Devers (SF) - 110.7mph - home_run
Kyle Stowers (MIA) - 110.4mph - home_run
Willson Contreras (STL) - 110.4mph - nan
Agustin Ramirez (MIA) - 109.7mph - home_run
Michael Busch (CHC) - 109.6mph - home_run
Willy Adames (SF) - 109.4mph - single
Top 10
Jac Caglianone - 65 PA, 0.266 wOBA, 0.382 xwOBA, 0.116 Diff
Paul Goldschmidt - 67 PA, 0.231 wOBA, 0.343 xwOBA, 0.112 Diff
Roman Anthony - 55 PA, 0.255 wOBA, 0.365 xwOBA, 0.11 Diff
Oneil Cruz - 76 PA, 0.192 wOBA, 0.301 xwOBA, 0.109 Diff
Matt Shaw - 64 PA, 0.21 wOBA, 0.294 xwOBA, 0.084 Diff
Ben Rice - 54 PA, 0.312 wOBA, 0.396 xwOBA, 0.084 Diff
Jesus Sanchez - 68 PA, 0.276 wOBA, 0.355 xwOBA, 0.079 Diff
Brenton Doyle - 69 PA, 0.225 wOBA, 0.301 xwOBA, 0.076 Diff
Freddie Freeman - 79 PA, 0.217 wOBA, 0.292 xwOBA, 0.075 Diff
Jonathan India - 70 PA, 0.278 wOBA, 0.353 xwOBA, 0.075 Diff
Bottom 10
Eugenio Suarez - 61 PA, 0.531 wOBA, 0.348 xwOBA, -0.183 Diff
Will Smith - 58 PA, 0.445 wOBA, 0.321 xwOBA, -0.124 Diff
Brooks Lee - 65 PA, 0.43 wOBA, 0.306 xwOBA, -0.124 Diff
Andy Pages - 74 PA, 0.371 wOBA, 0.263 xwOBA, -0.108 Diff
Cal Raleigh - 79 PA, 0.445 wOBA, 0.339 xwOBA, -0.106 Diff
Spencer Steer - 63 PA, 0.351 wOBA, 0.248 xwOBA, -0.103 Diff
Isaac Collins - 60 PA, 0.431 wOBA, 0.334 xwOBA, -0.097 Diff
Nick Kurtz - 62 PA, 0.395 wOBA, 0.304 xwOBA, -0.091 Diff
Colton Cowser - 58 PA, 0.337 wOBA, 0.249 xwOBA, -0.088 Diff
Cole Young - 59 PA, 0.293 wOBA, 0.207 xwOBA, -0.086 Diff
Juan Soto: 40.0 PA, +0.257 xwOBA OE
Vladimir Guerrero Jr.: 36.0 PA, +0.175 xwOBA OE
Yandy Diaz: 41.0 PA, +0.174 xwOBA OE
Kyle Stowers: 32.0 PA, +0.128 xwOBA OE
Riley Greene: 39.0 PA, +0.123 xwOBA OE
Agustin Ramirez: 35.0 PA, +0.12 xwOBA OE
Ketel Marte: 40.0 PA, +0.114 xwOBA OE
Ronald Acuna Jr.: 45.0 PA, +0.111 xwOBA OE
Max Muncy: 30.0 PA, +0.108 xwOBA OE
Jeremy Pena: 41.0 PA, +0.101 xwOBA OE
Byron Buxton: 43.0 PA, +0.096 xwOBA OE
Jesus Sanchez: 32.0 PA, +0.093 xwOBA OE
Jo Adell: 38.0 PA, +0.086 xwOBA OE
Roman Anthony: 32.0 PA, +0.085 xwOBA OE
Carlos Correa: 40.0 PA, +0.083 xwOBA OE
Tyler Soderstrom: 29.0 PA, -0.16 xwOBA OE
Isiah Kiner-Falefa: 32.0 PA, -0.158 xwOBA OE
Anthony Volpe: 33.0 PA, -0.146 xwOBA OE
Maxwell Muncy: 31.0 PA, -0.137 xwOBA OE
Oneil Cruz: 37.0 PA, -0.135 xwOBA OE
Cedric Mullins II: 30.0 PA, -0.133 xwOBA OE
Michael Harris II: 38.0 PA, -0.127 xwOBA OE
Mookie Betts: 38.0 PA, -0.124 xwOBA OE
Matt Wallner: 39.0 PA, -0.123 xwOBA OE
Austin Wells: 29.0 PA, -0.117 xwOBA OE
J.P. Crawford: 39.0 PA, -0.107 xwOBA OE
Ronny Mauricio: 28.0 PA, -0.099 xwOBA OE
Jose Herrera: 28.0 PA, -0.099 xwOBA OE
Manny Machado: 40.0 PA, -0.099 xwOBA OE
Pedro Pages: 30.0 PA, -0.097 xwOBA OE
Aaron Judge - 79 PA, 41 BIP, 11 Brls, 26.8 Brl%
Seiya Suzuki - 82 PA, 54 BIP, 14 Brls, 25.9 Brl%
Jo Adell - 75 PA, 45 BIP, 10 Brls, 22.2 Brl%
Mickey Moniak - 44 PA, 27 BIP, 6 Brls, 22.2 Brl%
Juan Soto - 82 PA, 52 BIP, 11 Brls, 21.2 Brl%
James Wood - 83 PA, 48 BIP, 10 Brls, 20.8 Brl%
Mike Trout - 81 PA, 39 BIP, 8 Brls, 20.5 Brl%
Shohei Ohtani - 86 PA, 52 BIP, 10 Brls, 19.2 Brl%
Henry Davis - 43 PA, 26 BIP, 5 Brls, 19.2 Brl%
Brent Rooker - 81 PA, 58 BIP, 11 Brls, 19.0 Brl%
Juan Soto - 82 PA, 0.561 xwOBA
Yandy Diaz - 78 PA, 0.455 xwOBA
Byron Buxton - 71 PA, 0.453 xwOBA
Jonathan Aranda - 79 PA, 0.445 xwOBA
Jo Adell - 75 PA, 0.444 xwOBA
Colt Keith - 50 PA, 0.443 xwOBA
Vladimir Guerrero Jr. - 71 PA, 0.439 xwOBA
Ronald Acuna Jr. - 84 PA, 0.436 xwOBA
Matt Olson - 85 PA, 0.425 xwOBA
Max Muncy - 69 PA, 0.421 xwOBA
Luis Arraez - 84 PA, 145 Swings, 96.6 Cont%
Keibert Ruiz - 43 PA, 76 Swings, 93.4 Cont%
Xavier Edwards - 82 PA, 144 Swings, 93.1 Cont%
Nico Hoerner - 71 PA, 127 Swings, 91.3 Cont%
Tyler Freeman - 72 PA, 125 Swings, 91.2 Cont%
Jacob Wilson - 72 PA, 123 Swings, 91.1 Cont%
Steven Kwan - 62 PA, 101 Swings, 91.1 Cont%
Jung Hoo Lee - 68 PA, 109 Swings, 90.8 Cont%
Jacob Young - 45 PA, 76 Swings, 89.5 Cont%
Marcus Semien - 78 PA, 136 Swings, 89.0 Cont%
Jacob Young - 5 Attempts (2 steals)
Jose Caballero - 5 Attempts (4 steals)
Tyler Freeman - 5 Attempts (3 steals)
Brice Turang - 4 Attempts (1 steals)
Maikel Garcia - 4 Attempts (2 steals)
Jake Meyers - 4 Attempts (2 steals)
Sam Haggerty - 4 Attempts (3 steals)
Jasson Dominguez - 3 Attempts (3 steals)
Spencer Steer - 3 Attempts (3 steals)
Geraldo Perdomo - 3 Attempts (1 steals)
Victor Scott II - 3 Attempts (3 steals)
Lane Thomas - 3 Attempts (2 steals)
Zach McKinstry - 3 Attempts (2 steals)
Xavier Edwards - 3 Attempts (3 steals)
C.J. Abrams - 3 Attempts (3 steals)
Ronald Acuna Jr. - 3 Attempts (3 steals)
Jose Caballero - 14 Attempts (12 steals)
Oneil Cruz - 10 Attempts (8 steals)
Jeremy Pena - 10 Attempts (9 steals)
Zach Neto - 10 Attempts (5 steals)
Pete Crow-Armstrong - 9 Attempts (8 steals)
Maikel Garcia - 9 Attempts (7 steals)
Fernando Tatis Jr. - 8 Attempts (8 steals)
Julio Rodriguez - 8 Attempts (7 steals)
Jose Ramirez - 8 Attempts (7 steals)
Tyler Freeman - 8 Attempts (6 steals)
Zach McKinstry - 8 Attempts (7 steals)
Jackson Chourio - 8 Attempts (6 steals)
Brent Rooker - 81 PA, 14.8 K%, 19.0 Brl%
Byron Buxton - 71 PA, 14.1 K%, 16.3 Brl%
Colt Keith - 50 PA, 14.0 K%, 18.4 Brl%
Elly De La Cruz - 74 PA, 18.9 K%, 16.4 Brl%
Juan Soto - 82 PA, 15.9 K%, 21.2 Brl%
Ketel Marte - 74 PA, 18.9 K%, 17.0 Brl%
Luis Garcia - 68 PA, 17.6 K%, 15.4 Brl%
Matt Olson - 85 PA, 20.0 K%, 15.4 Brl%
Max Kepler - 55 PA, 18.2 K%, 15.8 Brl%
Michael Busch - 65 PA, 18.5 K%, 14.6 Brl%
Vladimir Guerrero Jr. - 71 PA, 9.9 K%, 16.7 Brl%
Wenceel Perez - 57 PA, 17.5 K%, 14.0 Brl%
Yandy Diaz - 78 PA, 10.3 K%, 14.5 Brl%
Elly De La Cruz - 104 PA, +0.132 xwOBA
Jo Adell - 104 PA, +0.132 xwOBA
Max Muncy - 98 PA, +0.12 xwOBA
Tyler Freeman - 95 PA, +0.115 xwOBA
Hunter Goodman - 100 PA, +0.113 xwOBA
Juan Soto - 120 PA, +0.1 xwOBA
Luis Garcia - 103 PA, +0.091 xwOBA
Andrew Benintendi - 100 PA, +0.085 xwOBA
Michael Busch - 91 PA, +0.085 xwOBA
Willi Castro - 100 PA, +0.084 xwOBA
Seiya Suzuki - 117 PA, +12.6 Brl%
James Wood - 122 PA, +11.0 Brl%
Wenceel Perez - 90 PA, +10.9 Brl%
Andrew Benintendi - 100 PA, +10.0 Brl%
Elly De La Cruz - 104 PA, +10.0 Brl%
Hunter Goodman - 100 PA, +9.1 Brl%
Jo Adell - 104 PA, +8.5 Brl%
Alejandro Kirk - 98 PA, +8.5 Brl%
Ketel Marte - 103 PA, +7.9 Brl%
Colt Keith - 81 PA, +7.3 Brl%
Michael Busch - 91 PA, +11.7 Cont%
Byron Buxton - 101 PA, +10.7 Cont%
Matt McLain - 88 PA, +9.6 Cont%
Brent Rooker - 124 PA, +9.0 Cont%
Javier Baez - 85 PA, +8.1 Cont%
Junior Caminero - 118 PA, +7.8 Cont%
Gleyber Torres - 118 PA, +7.7 Cont%
Josh Bell - 97 PA, +7.6 Cont%
Xavier Edwards - 97 PA, +7.6 Cont%
Luis Urias - 96 PA, +7.5 Cont%
Brent Rooker - 124 PA, -15.1 K%
Jorge Polanco - 99 PA, -14.8 K%
Elly De La Cruz - 104 PA, -12.6 K%
Byron Buxton - 101 PA, -12.4 K%
Josh Bell - 97 PA, -11.9 K%
Michael Busch - 91 PA, -11.7 K%
Max Muncy - 98 PA, -11.0 K%
Matt McLain - 88 PA, -10.2 K%
Luis Urias - 96 PA, -9.5 K%
Fernando Tatis Jr. - 119 PA, -8.4 K%
Brice Turang: +2.7
Jackson Merrill: +2.6
Nathan Lukes: +2.37
Jose Caballero: +2.35
Ketel Marte: +2.32
Wilyer Abreu: -3.03
Connor Norby: -2.57
Manny Machado: -2.42
Nick Castellanos: -2.4
Xander Bogaerts: -2.15
Randy Arozarena - +4.8% Contact%, +3.5 mph exit velo, -10.0 Chase%
Masyn Winn - +3.1% Contact%, +4.1 mph exit velo, -6.4 Chase%
Heliot Ramos - +3.6% Contact%, +3.8 mph exit velo, -6.8 Chase%
Kyle Stowers - +11.4% Contact%, +4.9 mph exit velo, -10.7 Chase%
Adolis Garcia - +10.3% Contact%, +5.1 mph exit velo, -20.9 Chase%
Jonathan Aranda - +5.5% Contact%, +3.5 mph exit velo, -17.7 Chase%
Nolan Gorman - +6.6% Contact%, +8.4 mph exit velo, -3.7 Chase%
Willy Adames - +9.6% Contact%, +10.2 mph exit velo, -4.7 Chase%
Randal Grichuk - +7.0% Contact%, +4.3 mph exit velo, -3.7 Chase%
Ramon Urias - +11.6% Contact%, +3.5 mph exit velo, -4.5 Chase%
Jasson Dominguez - +13.5% Contact%, +4.8 mph exit velo, -15.4 Chase%
Gleyber Torres - 0.391 xwOBA, 11.9% Brl%, 88.2% Contact%, 16.9% Chase%, 12.1% K%
Juan Soto - 0.579 xwOBA, 23.7% Brl%, 81.7% Contact%, 11.9% Chase%, 13.8% K%
Matt Olson - 0.391 xwOBA, 10.5% Brl%, 77.9% Contact%, 19.7% Chase%, 18.6% K%
Michael Busch - 0.386 xwOBA, 11.1% Brl%, 84.7% Contact%, 20.9% Chase%, 14.9% K%
Ronald Acuna Jr. - 0.46 xwOBA, 21.9% Brl%, 75.5% Contact%, 23.9% Chase%, 19.3% K%
Yandy Diaz - 0.46 xwOBA, 17.8% Brl%, 82.2% Contact%, 23.3% Chase%, 8.9% K%
Luis Robert - 37.7% Whiff%, 75.0% Weak%, 0.968 Cold Rating
Gabriel Arias - 49.4% Whiff%, 71.4% Weak%, 0.953 Cold Rating
Alek Thomas - 33.8% Whiff%, 80.0% Weak%, 0.946 Cold Rating
Giancarlo Stanton - 38.6% Whiff%, 70.6% Weak%, 0.936 Cold Rating
Evan Carter - 31.6% Whiff%, 87.0% Weak%, 0.919 Cold Rating
Carlos Narvaez - 35.6% Whiff%, 66.7% Weak%, 0.888 Cold Rating
Oneil Cruz - 34.4% Whiff%, 66.7% Weak%, 0.878 Cold Rating
Brett Baty - 34.3% Whiff%, 66.7% Weak%, 0.875 Cold Rating
Jose Caballero - 32.3% Whiff%, 66.7% Weak%, 0.849 Cold Rating
Josh Jung - 28.6% Whiff%, 73.3% Weak%, 0.841 Cold Rating
Colson Montgomery (CWS): 3/4, 4R, 2HR, 3RBI, 0SB, 39FPts
Tucker Flint (LAA): 3/5, 2R, 2HR, 6RBI, 0SB, 39FPts
Dairon Blanco (KC): 4/5, 3R, 1HR, 3RBI, 0SB, 33FPts
Carlos Perez - 542208 (CHC): 3/4, 2R, 2HR, 3RBI, 0SB, 33FPts
Oliver Dunn (MIL): 3/4, 1R, 1HR, 2RBI, 1SB, 32FPts
Drew Ellis (SF): 2/5, 2R, 2HR, 4RBI, 0SB, 32FPts
MJ Melendez (KC): 3/5, 3R, 1HR, 3RBI, 0SB, 32FPts
Yanquiel Fernandez (COL): 2/4, 2R, 1HR, 5RBI, 0SB, 31FPts
Carlos Cortes (OAK): 4/5, 2R, 1HR, 2RBI, 0SB, 29FPts
Cam Devanney (KC): 3/6, 3R, 1HR, 2RBI, 0SB, 28FPts
Joander Suarez (NYM): 81 Pitches, 6IP, 2H, 1ER, 8K, 0BB, 30FPts
Curtis Taylor (STL): 86 Pitches, 6IP, 3H, 2ER, 10K, 3BB, 25FPts
Rich Hill (KC): 93 Pitches, 6IP, 6H, 2ER, 8K, 1BB, 25FPts
McCade Brown (COL): 57 Pitches, 5IP, 2H, 1ER, 6K, 0BB, 24FPts
Blake Burkhalter (nan): 89 Pitches, 5IP, 4H, 1ER, 7K, 3BB, 23FPts
Kai-Wei Teng (SF): 70 Pitches, 4IP, 0H, 0ER, 8K, 3BB, 23FPts
Ian Seymour (TB): 90 Pitches, 6IP, 6H, 1ER, 5K, 0BB, 21FPts
Alex Williams (MIA): 74 Pitches, 4IP, 5H, 2ER, 7K, 0BB, 21FPts
Mitch Neunborn (PHI): 50 Pitches, 4IP, 2H, 0ER, 5K, 1BB, 21FPts
Victor Mederos (LAA): 103 Pitches, 6IP, 11H, 3ER, 8K, 0BB, 20FPts
Jordan Lawlar (AAA - ARI) 250 PA 0.991 OPS
Max Anderson (AA - DET) 274 PA 0.986 OPS
C.J. Kayfus (AAA - CLE) 281 PA 0.978 OPS
Nathan Church (AAA - STL) 212 PA 0.974 OPS
Carlos Cortes (AAA - OAK) 232 PA 0.973 OPS
Chad Stevens (AAA - LAA) 279 PA 0.971 OPS
Ryan Ward (AAA - LAD) 333 PA 0.966 OPS
Brock Wilken (AA - MIL) 283 PA 0.942 OPS
Shay Whitcomb (AAA - HOU) 246 PA 0.939 OPS
Cam Devanney (AAA - KC) 254 PA 0.934 OPS
James Outman (AAA - LAD) 293 PA 0.931 OPS
Carson McCusker (AAA - MIN) 242 PA 0.92 OPS
Anthony Seigler (AAA - MIL) 254 PA 0.91 OPS
Blaine Crim (AAA - TEX) 281 PA 0.907 OPS
Daniel Susac (AAA - OAK) 223 PA 0.907 OPS
Tristin English (AAA - ARI) 225 PA 0.906 OPS
Keaton Anthony (AAA - PHI) 243 PA 0.905 OPS
Blaze Jordan (AAA - BOS) 262 PA 0.904 OPS
Colby Thomas (AAA - OAK) 344 PA 0.903 OPS
Samad Taylor (AAA - SEA) 307 PA 0.902 OPS
Jonah Tong (AA - NYM) 67 IP 29.5% K-BB
Mitch Bratt (AA - TEX) 62 IP 26.2% K-BB
Cam Schlittler (AAA - NYY) 74 IP 24.5% K-BB
Jack Wenninger (AA - NYM) 71 IP 23.7% K-BB
Ian Seymour (AAA - TB) 80 IP 23.7% K-BB
Troy Melton (AAA - DET) 55 IP 23.2% K-BB
John Klein (AA - MIN) 58 IP 22.8% K-BB
Joe Boyle (AAA - TB) 68 IP 22.2% K-BB
Tekoah Roby (AAA - STL) 63 IP 22.1% K-BB
Kohl Drake (AA - TEX) 55 IP 21.8% K-BB
Logan Henderson (AAA - MIL) 53 IP 21.5% K-BB
Tyler Uberstine (AAA - BOS) 62 IP 21.1% K-BB
Wilber Dotel (AA - PIT) 66 IP 21.1% K-BB
Joander Suarez (AA - NYM) 54 IP 20.6% K-BB
Blake Wehunt (AA - BOS) 52 IP 20.6% K-BB
Trenton Denholm (AA - CLE) 62 IP 20.3% K-BB
Hunter Barco (AAA - PIT) 51 IP 20.0% K-BB
Robby Snelling (AA - MIA) 67 IP 19.9% K-BB
Luis Morales (AAA - OAK) 71 IP 19.9% K-BB
Shane Murphy (AA - CWS) 55 IP 19.2% K-BB
Will Warren (43.0% Owned): Projected 5.81IP 2.3ER 7.59SO 2.48BB 21.05FPts
Jose Soriano (39.0% Owned): Projected 5.78IP 2.7ER 4.92SO 2.36BB 13.99FPts
Jose Quintana (19.5% Owned): Projected 5.99IP 2.92ER 4.91SO 2.54BB 13.97FPts
Donovan Solano - 28 PA, 1.305 OPS
Mauricio Dubon - 30 PA, 1.182 OPS
Isaac Collins - 34 PA, 1.137 OPS
Trevor Larnach - 35 PA, 1.062 OPS
Drake Baldwin - 28 PA, 1.036 OPS
Kyle Stowers - 32 PA, 1.022 OPS
Trent Grisham - 33 PA, 1.015 OPS
Pavin Smith - 29 PA, 1.011 OPS
Wenceel Perez - 32 PA, 1.01 OPS
Casey Schmitt - 31 PA, 0.987 OPS
Jordan Beck RF (13.0% Owned): Projected 0.78R 0.24HR 0.77RBI 1.19SO 0.39BB 0.16SB 10.09FPts
Drake Baldwin C (15.5% Owned): Projected 0.71R 0.23HR 0.83RBI 0.69SO 0.37BB 0.02SB 9.49FPts
Roman Anthony OF (39.0% Owned): Projected 0.73R 0.2HR 0.76RBI 1.04SO 0.63BB 0.09SB 9.41FPts
Jo Adell LF (25.0% Owned): Projected 0.68R 0.27HR 0.77RBI 1.04SO 0.24BB 0.1SB 9.25FPts
Addison Barger 3B (23.5% Owned): Projected 0.79R 0.19HR 0.65RBI 1.06SO 0.36BB 0.05SB 9.21FPts
Xavier Edwards SS (39.5% Owned): Projected 0.73R 0.05HR 0.51RBI 0.68SO 0.41BB 0.25SB 9.14FPts
Nolan Schanuel 1B (16.0% Owned): Projected 0.83R 0.15HR 0.57RBI 0.58SO 0.43BB 0.07SB 9.07FPts
Sal Frelick OF (31.5% Owned): Projected 0.78R 0.09HR 0.55RBI 0.58SO 0.38BB 0.18SB 9.05FPts
Wilyer Abreu RF (48.5% Owned): Projected 0.65R 0.19HR 0.73RBI 1.08SO 0.39BB 0.07SB 8.85FPts
Jesus Sanchez CF (5.5% Owned): Projected 0.71R 0.17HR 0.6RBI 1.06SO 0.34BB 0.11SB 8.85FPts