MLB Daily Notes - June 5th
A daily automated report of what happened yesterday in Major League Baseball, along with other recent trends and further analysis.
Pitcher Review
Frankie Montas ripped off quite a start.
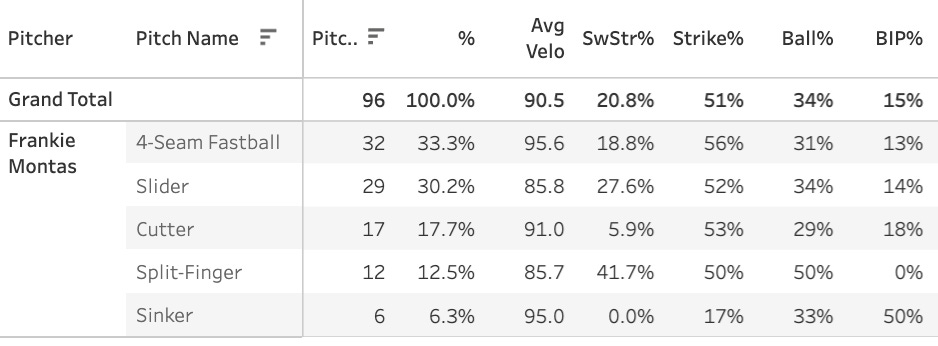
7 IP, 1 H, 0 R, 9 K, 2 BB, 20.8% SwStr%, 51% strike%, 34.4% Ball%
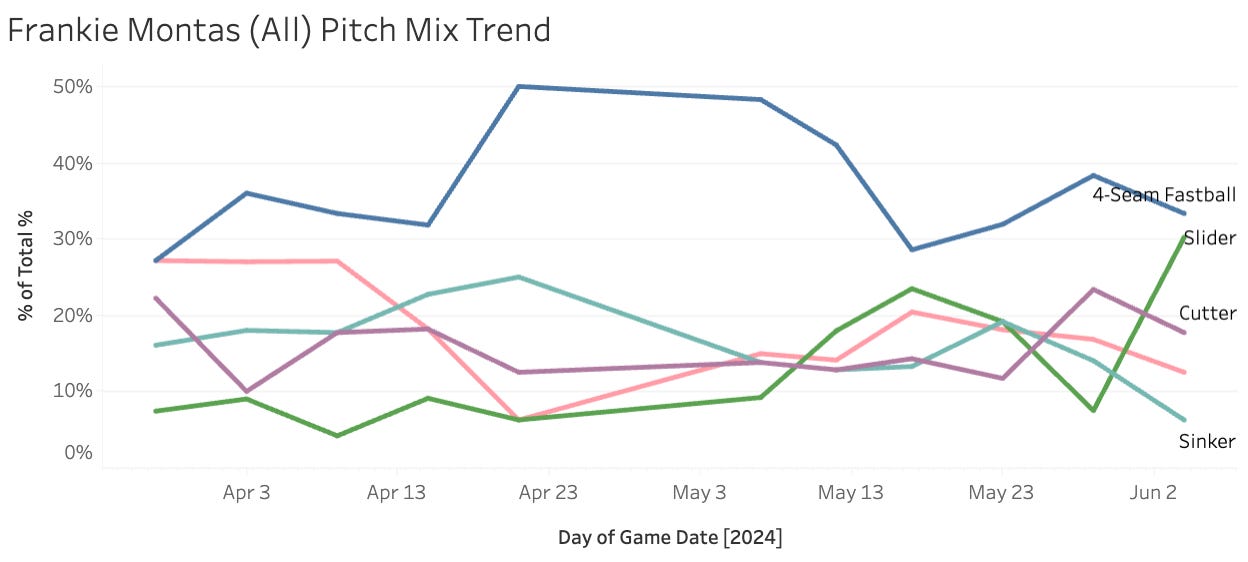
This was his best outing of the year by far. It was also his highest slider usage of the year
He was at just 8% slider usage before early May. But since May 8th he’s using it 18% of the time, and the pitch has a pretty nice 51% Strike% and 17% SwStr%. Overall still in this time he has just an 11.6% SwStr% and 47% Strike%, so he’s not been great - but last night was a start that’s hard to shrug off.
He went 30% slider usage and got just a ton of whiffs on it while the fastball worked well with it:
Montas was a super intriguing pitcher a few years back, and I remember it being all about that heavy fastball, the sinker, and the wicked slider. So I think there’s more upside here than what we think generally, but I wouldn’t over-react to one start either, he had looked pretty crappy before that.
If you read the slate preview yesterday, you saw me write this:
“There’s not much chance at a ten strikeout game and a 40-point performance from Fried”
And I was right, there wasn’t much of a chance at that - because he struck out 13. That was just his second double-digit strikeout game since 2021.
Everything was working for him last night, obviously, and now his season K% is up to 23.1% (it was 20.6% yesterday). That plus a 7.6% BB% and a 61% GB% and you have yourself a fantasy ace. Fried is one of the few guys that has proven to be able to consistently deliver soft contact (or at least avoid barrels), so we can more or less count on his barrel rate sticking around the low mark it’s at right now (4.6%).
Lowest Brl% Allowed Since 2023 (25 GS minimum)
Fried 4.2%
Wheeler 5.5%
Steele 5.6%
Houck 5.6%
Burnes 5.6%
Shota Imanaga got thumped again for seven hits and five runs, but only one was earned and the other stuff looked pretty good:
20.3% SwStr%, 49.3% Strike%, 30.4% Ball%, 6:0 K:BB
So I wouldn’t worry about that at all.
Quick notes on some other guys
Luis Gil posted six more scoreless innings and gave up just one more hit, his ridiculous year continues, at this point he’s in the Cy Young conversation. The one bad point is the 39.8% Ball% and three walks, but that really doesn’t matter much if you’re not allowing any hits to move those free passes around the bases.
Jesus Luzardo had a disastrous outing, giving up nine earned runs. He delivered three scoreless to start the outing but then the fourth and fifth went about as bad as you can imagine. Only two walks allowed but he wasn’t fooling anybody with a 10.8% SwStr% and 42.2% Strike%
George Kirby took full advantage of the Athletics matchup and struck out nine on a 17% SwStr%.
Ryan Pepiot continued his very strong season with a quality start on an 8:0 K:BB and a high 19.1% SwStr%. He is up to a 29% K% and 8% BB%, to be just one of 18 pitchers with 10 starts and a K-BB% above 20%.
Jared Jones did the seemingly impossible and fired off six scoreless innings against the Dodgers, but it was another low whiff game for him at a 12% SwStr% and 46% Strike%. The velocity was through the roof as you probably saw and he didn’t give up much in terms of well-hit balls, so great stuff from Jones but yeah I’d call him a definite sell-high right now given the declining strikeout rate (23.6% since May 1st).
Patrick Sandoval is having probably a career-best season with a 24.2% K% and 9.6% BB%. Those aren’t great numbers, but the strikeouts are up from what we’ve gotten used to. His SIERA is 3.89, much better than last year’s effort of 5.00.
Reader Questions
Would it be possible to do a daily automated MLB best statistical stacks report? - Duncan
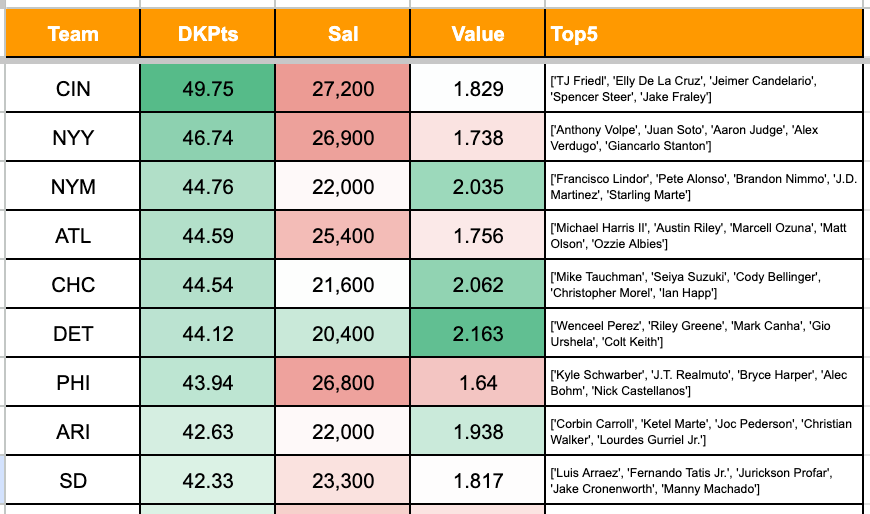
I’m guessing this has to do with DFS, and I already pretty much do that on the projections, on the Google Sheet it looks at the top five in each lineup and gives you their sum projection, salary, and price.
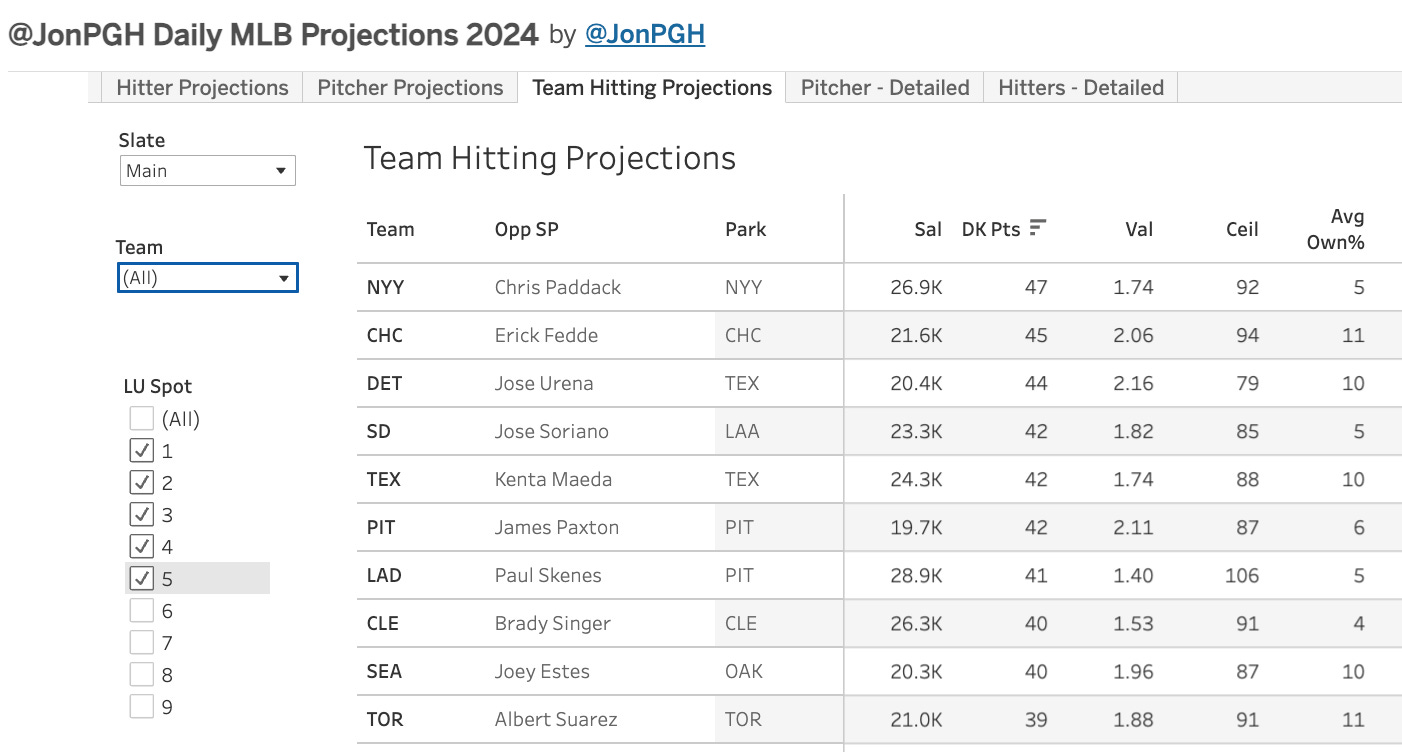
On the dashboard, you can actually pick which spots you’re interested and it’ll show you the summarized projection. What I have been doing lately for my DFS lineups (with a lot of success actually but knock on wood) is selecting lineup slots 1-5 and then sorting by the “DK Pts” column first (this is the raw projection) and then the “Val” column next. From there I pick two offenses, the top raw projection and the top value, and then I fill out my hitter lineup starting from there.
So that’s a pretty solid way to approach it if you’re using my projections for DFS. Thanks for the question.
Hey Jon can you please evaluate Masyn Winn, Alex Burelson, and Colt Keith thanks!
Those three are good names to check on and I’m a little upset with myself that I hadn’t mentioned them much this year, especially Winn.
Winn:
.309/.349/.446, 3 HR, 1.4% Brl%, 16.9% K%, 84% Cont%, 8 SB
So this seems like a Steven Kwan type profile with the solid batting average, low strikeouts, and a decent amount of steals. The 21% stolen base attempt rate is good, but a good step below the league leaders.
If we look at this batted profile, we see a lot of line drives. The way to hit for a high batting average is two-fold
Don’t strike out much
Hit a lot of line drives
His 34% line drive is tied for the league lead, and how about this, it’s tied with Steven Kwan! He does hit the ball a bit harder than Kwan, but he’s not swinging the bat hard. The 28% hard hit rate is very low. His 69mph average bat speed is just a couple of ticks below the league average. The slowest swings in the league are in the mid-60’s, so he’s not at at Nicky Lopez or Nick Madrigal level.
I’d call him Steven Kwan with slightly more power upside. In deep leagues, that’s already more than good enough for a roster spot, but in like a 12-team standard roto league you’re just not going to get enough power from him to justify the roster spot, in my opinion.
As for Burleson, this guy has about league-average power but also rarely strikes out.
183 PA, .276/.306/.448, 8 HR, 6% Brl%, 14% K%, 80% Cont%, 2 SB
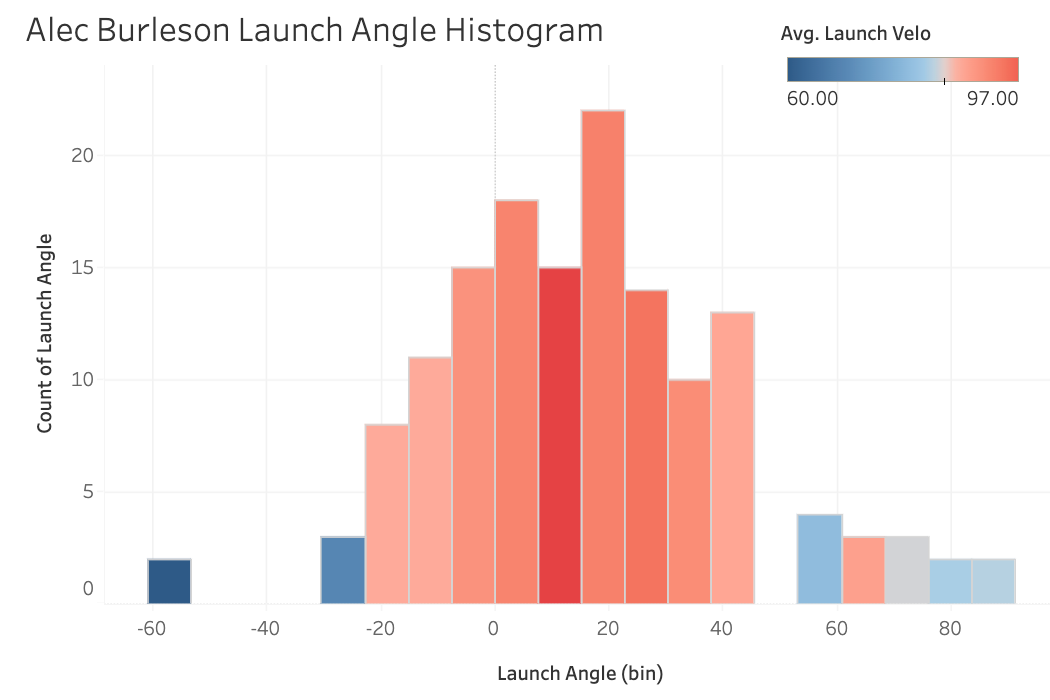
He is also hitting a good number of line drives at 29%, and he has kept the ground ball rate under 40% at 38%. So he’s got some power and gets the ball off the ground, but why the lower 6% barrel rate then?
It seems like he’s just a handful of degrees short of the barrel criteria on many occasions:
His pull rate is also low at 34%, so it seems like he is a little more concerned with putting balls in play than hitting balls over the fence. But there’s more power upside in the bat here than a lot of other guys, so you could see some really nice stretches of production from Burleson. He’s still just 25 even though to me it seems like he’s just been a career AAA hitter, so that’s good news too. I like what I’m seeing here, but he’s not a 12-team guy at this point.
That will have to be it for today. I am going to do my best to get a game previews post out, but I’m really up against it. I am currently wrestling baby Trea with one arm while trying to finish this bad boy.
Pitcher Reports
Algo SP Ranks - Yesterday
1. Frankie Montas
2. Max Fried
3. Shota Imanaga
4. Ryan Pepiot
5. George Kirby
6. Jack Flaherty
7. Patrick Sandoval
8. Kutter Crawford
9. Luis Gil
10. Chris Flexen
11. Tyler Glasnow
12. Kyle Harrison
13. Spencer Arrighetti
14. Jared Jones
15. DJ Herz
16. Corbin Burnes
17. David Peterson
18. Triston McKenzie
19. Jesus Luzardo
20. Blake Walston
21. Adam Mazur
22. Seth Lugo
23. Bailey Ober
24. Cristopher Sanchez
25. Mitch Spence
26. Dane Dunning
27. Andre Pallante
28. Ty Blach
Fantasy Points Leaders - Yesterday
1. Max Fried (vs. BOS): 38.75 Points
2. Frankie Montas (vs. COL): 35.95 Points
3. Luis Gil (vs. MIN): 27.1 Points
4. Tyler Glasnow (vs. PIT): 26.5 Points
5. Jared Jones (vs. LAD): 25.9 Points
6. George Kirby (vs. OAK): 25.05 Points
7. Corbin Burnes (vs. TOR): 24.75 Points
8. Ryan Pepiot (vs. MIA): 23.9 Points
9. Patrick Sandoval (vs. SD): 22.5 Points
10. Jack Flaherty (vs. TEX): 22.05 Points
Whiffs Leaders - Yesterday
1. Max Fried (ATL): 21 Whiffs (103 Pitches)
2. Frankie Montas (CIN): 20 Whiffs (96 Pitches)
3. Patrick Sandoval (LAA): 17 Whiffs (100 Pitches)
4. Ryan Pepiot (TB): 17 Whiffs (89 Pitches)
5. George Kirby (SEA): 16 Whiffs (94 Pitches)
6. Shota Imanaga (CHC): 14 Whiffs (69 Pitches)
7. Tyler Glasnow (LAD): 13 Whiffs (97 Pitches)
8. Kutter Crawford (BOS): 12 Whiffs (87 Pitches)
9. Jared Jones (PIT): 12 Whiffs (100 Pitches)
10. Kyle Harrison (SF): 11 Whiffs (95 Pitches)
Strike% Leaders - Yesterday
1. George Kirby (SEA): 56.4 Strike%, 30.9 Ball%
2. Max Fried (ATL): 56.3 Strike%, 32.0 Ball%
3. Patrick Sandoval (LAA): 55.0 Strike%, 30.0 Ball%
4. Jack Flaherty (DET): 53.3 Strike%, 26.7 Ball%
5. Frankie Montas (CIN): 51.0 Strike%, 34.4 Ball%
6. Ryan Pepiot (TB): 50.6 Strike%, 31.5 Ball%
7. Spencer Arrighetti (HOU): 50.0 Strike%, 37.5 Ball%
8. Tyler Glasnow (LAD): 49.5 Strike%, 37.1 Ball%
9. Kutter Crawford (BOS): 49.4 Strike%, 29.9 Ball%
10. Shota Imanaga (CHC): 49.3 Strike%, 30.4 Ball%
11. Cristopher Sanchez (PHI): 48.2 Strike%, 31.3 Ball%
12. Bowden Francis (TOR): 47.4 Strike%, 29.8 Ball%
13. Kyle Harrison (SF): 47.4 Strike%, 31.6 Ball%
14. Luis Gil (NYY): 46.6 Strike%, 39.8 Ball%
15. Corbin Burnes (BAL): 46.5 Strike%, 33.3 Ball%
Pitches/Out (POUT) Leaders - Yesterday
1. Jack Flaherty: 60 Pitches, 15 Outs, 4.0 POUT
2. David Peterson: 81 Pitches, 20 Outs, 4.05 POUT
3. Chris Flexen: 63 Pitches, 15 Outs, 4.2 POUT
4. Adam Mazur: 77 Pitches, 18 Outs, 4.28 POUT
5. Frankie Montas: 96 Pitches, 21 Outs, 4.57 POUT
6. Cristopher Sanchez: 83 Pitches, 18 Outs, 4.61 POUT
7. Corbin Burnes: 99 Pitches, 21 Outs, 4.71 POUT
8. Kutter Crawford: 87 Pitches, 18 Outs, 4.83 POUT
9. Luis Gil: 88 Pitches, 18 Outs, 4.89 POUT
10. Ryan Pepiot: 89 Pitches, 18 Outs, 4.94 POUT
Velo Changes - Yesterday
Cristopher Sanchez's CH velo (24 pitches) UP 2.8mph to 86.0
Patrick Sandoval's SL velo (22 pitches) UP 2.2mph to 89.4
Colin Rea's FC velo (16 pitches) UP 2.1mph to 89.2
Cristopher Sanchez's SL velo (19 pitches) UP 2.0mph to 85.1
Cristopher Sanchez's SI velo (39 pitches) UP 2.0mph to 95.1
Corbin Burnes's SI velo (13 pitches) UP 1.8mph to 97.4
Jared Jones's SL velo (29 pitches) UP 1.8mph to 90.3
Patrick Sandoval's FF velo (25 pitches) UP 1.8mph to 95.0
Triston McKenzie's SL velo (12 pitches) UP 1.7mph to 86.8
George Kirby's SL velo (27 pitches) UP 1.6mph to 87.9
Jesus Luzardo's FF velo (25 pitches) DOWN -1.5mph to 94.9
Seth Lugo's FF velo (23 pitches) DOWN -1.6mph to 91.5
Jesus Luzardo's CH velo (22 pitches) DOWN -1.9mph to 86.0
Jesus Luzardo's SI velo (11 pitches) DOWN -2.3mph to 93.6
Jesus Luzardo's SL velo (25 pitches) DOWN -2.5mph to 82.2
Pitch Mix Changes - Yesterday
Andre Pallante's SI usage (32.0%) up 23.8 points
Bailey Ober's FC usage (28.1%) up 20.7 points
Bowden Francis's FF usage (61.4%) up 10.2 points
David Peterson's SI usage (44.4%) up 18.9 points
David Peterson's SL usage (32.1%) up 11.5 points
Frankie Montas's SL usage (30.2%) up 16.7 points
Kyle Harrison's CH usage (29.5%) up 12.2 points
Max Fried's FC usage (13.6%) up 10.3 points
Ryan Pepiot's FF usage (62.9%) up 11.2 points
Triston McKenzie's CU usage (37.2%) up 13.0 points
Tyler Glasnow's SI usage (13.4%) up 11.6 points
Pitch Mix Changes - Last 3 Starts
Michael Lorenzen Slider: -18.1%
Javier Assad Sinker: +17.2%
Taijuan Walker Cutter: -16.5%
Cole Irvin 4-Seam Fastball: +16.3%
Luis Severino Sinker: +15.1%
Taijuan Walker Sweeper: +14.9%
Kenta Maeda Split-Finger: -14.6%
Nick Pivetta 4-Seam Fastball: +14.5%
Nick Pivetta Cutter: -14.3%
Patrick Sandoval Sweeper: +13.5%
Garrett Crochet Slider: -13.3%
Kevin Gausman Split-Finger: -13.2%
Bailey Falter Sinker: +13.2%
Charlie Morton 4-Seam Fastball: -13.2%
Luis Severino 4-Seam Fastball: -12.8%
Michael Wacha Slider: +12.7%
Michael Lorenzen Cutter: +12.2%
Griffin Canning Changeup: +12.1%
Shota Imanaga Split-Finger: +12.1%
Yusei Kikuchi Changeup: +12.0%
CSW% Leaders - Last 3 Weeks
Jack Flaherty - 87 TBF, 44.5% CSW%
Ben Brown - 78 TBF, 35.4% CSW%
Ray Kerr - 68 TBF, 34.3% CSW%
Luis Gil - 95 TBF, 33.7% CSW%
Kevin Gausman - 96 TBF, 33.7% CSW%
Grayson Rodriguez - 100 TBF, 33.2% CSW%
Ryan Weathers - 77 TBF, 32.4% CSW%
Tarik Skubal - 92 TBF, 32.3% CSW%
Tanner Houck - 101 TBF, 32.2% CSW%
Hunter Brown - 89 TBF, 32.1% CSW%
K% Leaders - Last 3 Weeks
Luis Gil - 95 TBF, 38.9% K%
Ben Brown - 78 TBF, 35.9% K%
Jack Flaherty - 87 TBF, 35.6% K%
Freddy Peralta - 90 TBF, 34.4% K%
Cole Ragans - 94 TBF, 34.0% K%
Ryan Weathers - 77 TBF, 33.8% K%
Tyler Glasnow - 93 TBF, 33.3% K%
Garrett Crochet - 89 TBF, 32.6% K%
Kyle Bradish - 82 TBF, 31.7% K%
Matt Waldron - 93 TBF, 31.2% K%
K-BB% Leaders - Last 3 Weeks
Jack Flaherty - 87 TBF, 31.0% K-BB%
Luis Gil - 95 TBF, 30.5% K-BB%
Freddy Peralta - 90 TBF, 28.9% K-BB%
Ryan Weathers - 77 TBF, 28.6% K-BB%
Ben Brown - 78 TBF, 28.2% K-BB%
Matt Waldron - 93 TBF, 26.9% K-BB%
Garrett Crochet - 89 TBF, 25.8% K-BB%
Chris Sale - 74 TBF, 25.7% K-BB%
Cole Ragans - 94 TBF, 25.5% K-BB%
Yoshinobu Yamamoto - 75 TBF, 25.3% K-BB%
GB% Leaders - Last 3 Weeks
Cristopher Sanchez - 95 TBF, 68.1% GB%
Framber Valdez - 100 TBF, 68.1% GB%
Brayan Bello - 99 TBF, 63.6% GB%
Ryan Weathers - 77 TBF, 63.0% GB%
Braxton Garrett - 76 TBF, 58.6% GB%
Max Fried - 109 TBF, 58.3% GB%
Kyle Gibson - 92 TBF, 53.1% GB%
Erick Fedde - 77 TBF, 52.8% GB%
Hunter Brown - 89 TBF, 52.6% GB%
Yoshinobu Yamamoto - 75 TBF, 52.1% GB%
Magic Formula Qualifiers - Pitchers - Last 3 Weeks
Chris Sale - 74 TBF, 28.4 K%, 2.7 BB%, 43.1% GB%
Clarke Schmidt - 73 TBF, 27.4 K%, 6.8 BB%, 43.5% GB%
Garrett Crochet - 89 TBF, 32.6 K%, 6.7 BB%, 48.1% GB%
Hunter Brown - 89 TBF, 27.0 K%, 7.9 BB%, 52.6% GB%
Jack Flaherty - 87 TBF, 35.6 K%, 4.6 BB%, 48.1% GB%
Max Fried - 109 TBF, 27.5 K%, 4.6 BB%, 58.3% GB%
Paul Skenes - 64 TBF, 35.9 K%, 4.7 BB%, 52.6% GB%
Ryan Weathers - 77 TBF, 33.8 K%, 5.2 BB%, 63.0% GB%
Tarik Skubal - 92 TBF, 28.3 K%, 5.4 BB%, 49.2% GB%
Yoshinobu Yamamoto - 75 TBF, 30.7 K%, 5.3 BB%, 52.1% GB%
SIERA vs. ERA Comp, Last 30 Days
Unluckiest
Reid Detmers: 9.53 ERA, 4.38 SIERA
Ross Stripling: 9.97 ERA, 5.24 SIERA
Martin Perez: 8.31 ERA, 4.41 SIERA
Blake Snell: 7.5 ERA, 3.98 SIERA
Mason Black: 8.79 ERA, 5.45 SIERA
Nick Nastrini: 10.95 ERA, 7.68 SIERA
Cristian Javier: 8.74 ERA, 5.73 SIERA
Kenta Maeda: 9.25 ERA, 6.24 SIERA
Ryan Feltner: 7.66 ERA, 4.7 SIERA
Sonny Gray: 5.4 ERA, 2.84 SIERA
Luckiest
Bailey Falter: 1.67 ERA, 5.37 SIERA
Tyler Anderson: 2.5 ERA, 5.42 SIERA
Marcus Stroman: 1.95 ERA, 4.64 SIERA
Bryan Woo: 1.3 ERA, 3.84 SIERA
Griffin Canning: 2.22 ERA, 4.71 SIERA
Mitch Keller: 1.34 ERA, 3.76 SIERA
Austin Gomber: 1.9 ERA, 4.21 SIERA
Clarke Schmidt: 1.09 ERA, 3.38 SIERA
Luis Gil: 0.7 ERA, 2.99 SIERA
Jon Gray: 1.56 ERA, 3.84 SIERA
Hot Pitcher Tracker - Last 3 Weeks vs. Career
Jack Flaherty - +4.1% CSW%, -4.2 BB%
Ryan Weathers - +4.6% CSW%, -4.0 BB%
Zac Gallen - +5.4% CSW%, -4.3 BB%
Brad Keller - +3.1% CSW%, -7.5 BB%
Hitter Reports
Multiple Barrels
Bobby Witt Jr. (KC) 5 PA, 5 Swings, 2 Barrels, 2 HR
Brandon Lowe (TB) 5 PA, 9 Swings, 2 Barrels, 1 HR
Francisco Lindor (NYM) 5 PA, 9 Swings, 2 Barrels, 0 HR
Teoscar Hernandez (LAD) 4 PA, 7 Swings, 2 Barrels, 0 HR
Hardest Hit Balls
Keibert Ruiz (WSH) - 114.0mph - nan
William Contreras (MIL) - 113.2mph - single
Jake Burger (MIA) - 112.7mph - single
Pete Alonso (NYM) - 111.7mph - home_run
Brent Rooker (OAK) - 110.7mph - double
Bryan Reynolds (PIT) - 110.5mph - single
Giancarlo Stanton (NYY) - 110.4mph - home_run
Royce Lewis (MIN) - 110.1mph - home_run
Christian Walker (ARI) - 110.0mph - double
Miguel Andujar (OAK) - 109.9mph - force_out
Become a paid sub today to get the rest of the daily notes. It’s just $9/month and you get absolutely everything that I do here. Check out the about page here for more. 10% of your subscription goes to charitable organizations such as Samaritan’s Purse, a Christian humanitarian aid organization.


