


Introducing and Explaining JA ERA+
A quick explanation of what "JA ERA" is and how to best use it.


This year, I have been relying on two stats I created for analyzing pitchers. They are WHIP+ and JA ERA. WHIP+ was introduced and explained here.
So I felt the need to put together an “evergreen” article for JA ERA.
But this one can be really short and sweet, because it’s nothing new and nothing all that special.
All it is is my own version of SIERA. I’m not going to explain SIERA, because it’s already been done here, and also here. So if you have no idea what I’m talking about, and you want to, read that article first.
And when I say “my own version”, you might think that means I intelligently tweaked SIERA to make a better version of it. But that’s not what we’re talking about. JA ERA was born when I was trying to replicate SIERA on my dashboards. My goal for the last few years has been to make my own resources (mostly on Tableau) so I never have to go to another website. I want everything in one place for my own use. And SIERA has alluded me.
But I finally consulted the AI bot and got it done. Here’s a calculation for SIERA:
SIERA = 6.145 - 16.986 * (SO/PA) + 11.434 * (BB/PA) - 1.858 * ((GB-FB-PU)/PA) + 7.653 * ((SO/PA)^2) - 6.664 * (((GB-FB-PU)/PA)^2) + 10.130 * (SO/PA) * ((GB-FB-PU)/PA) - 5.195 * (BB/PA) * ((GB-FB-PU)/PA)I don’t think this is perfectly up to date. The weights (the actual unchanging numbers there) are probably different now. But it works fine. And there’s also a difference between what FanGraphs might consider a ground ball, a fly ball, or a popup and what MLB Savant might consider. So my numbers were never going to match exactly what you get from FanGraphs.
I’m not claiming mine is better than SIERA. But the advantage we have now is accessibility and customization.
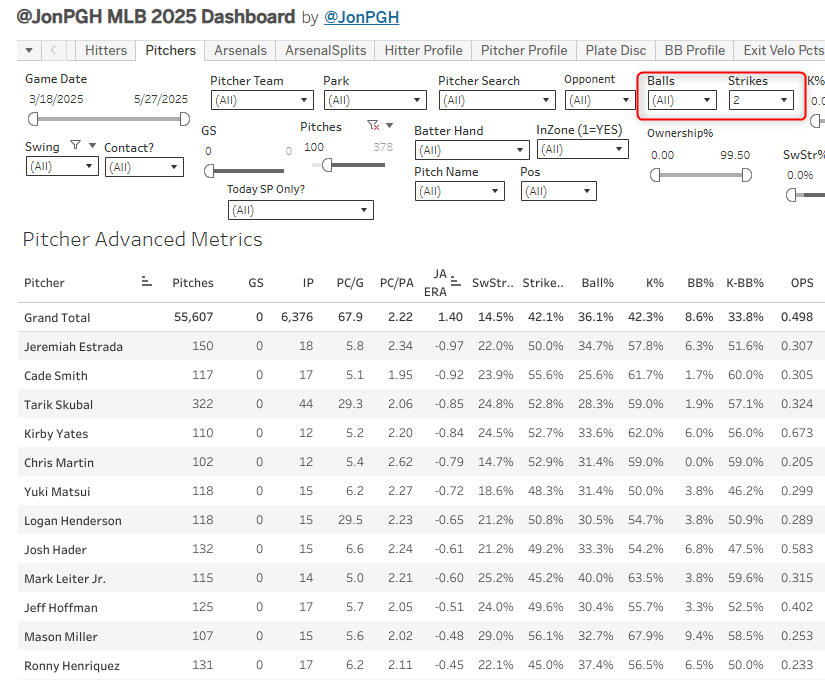
I’ve put the metric in two places. First, the main “Pitchers” dashboard”:

That top line in bold will show you the average for the sample you’ve selected. If you put no filters on, it will show you the overall league average. But when you start manipulating it (say, filtering to low-owned SPs), those bold numbers will update to only the average of the pitchers that meeting your chosen criteria.
I’ve also put it on the Pitcher Profile tab, which is probably the tab I spend the most time on personally.
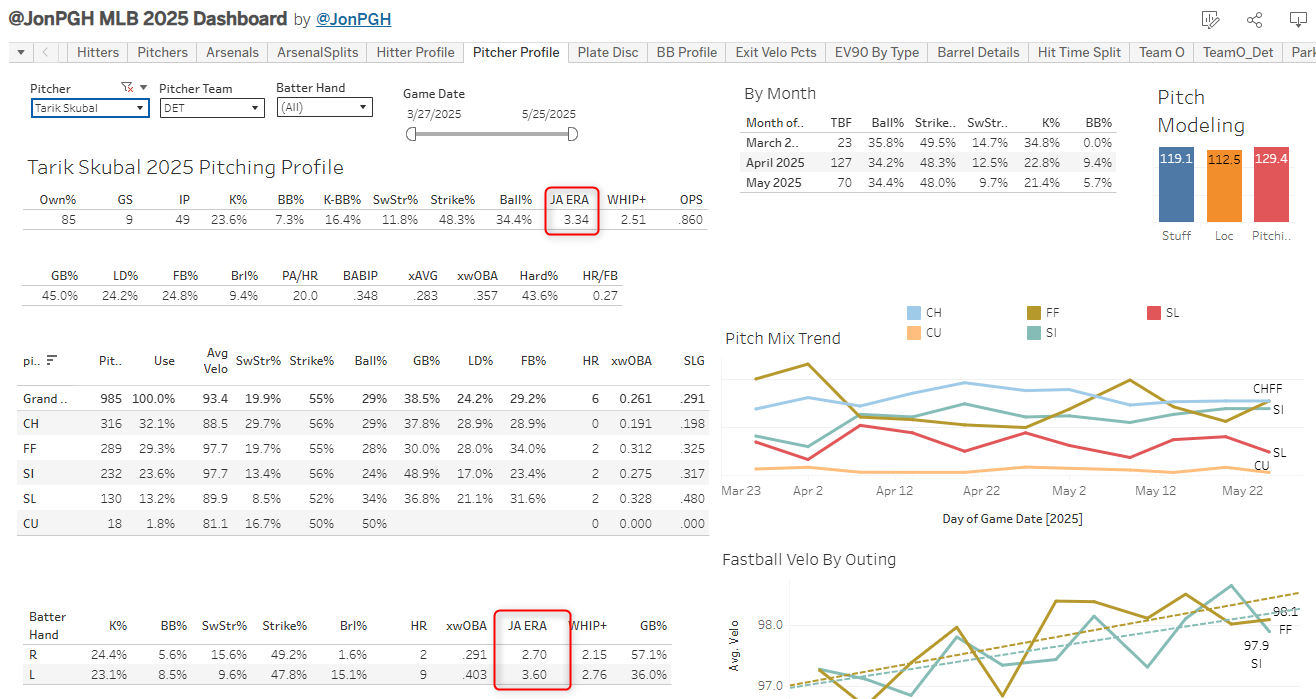
It’s not that hard to just go to a player page on FanGraphs and see their SIERA. But my dashboard makes the customization way quicker, cleaner, and easier.
You can find JA ERA numbers in a ton of different splits. Just mess around with the dials at the top of that main pitchers tab and watch the numbers change.
Date ranges:

Count analysis:
Ownership:

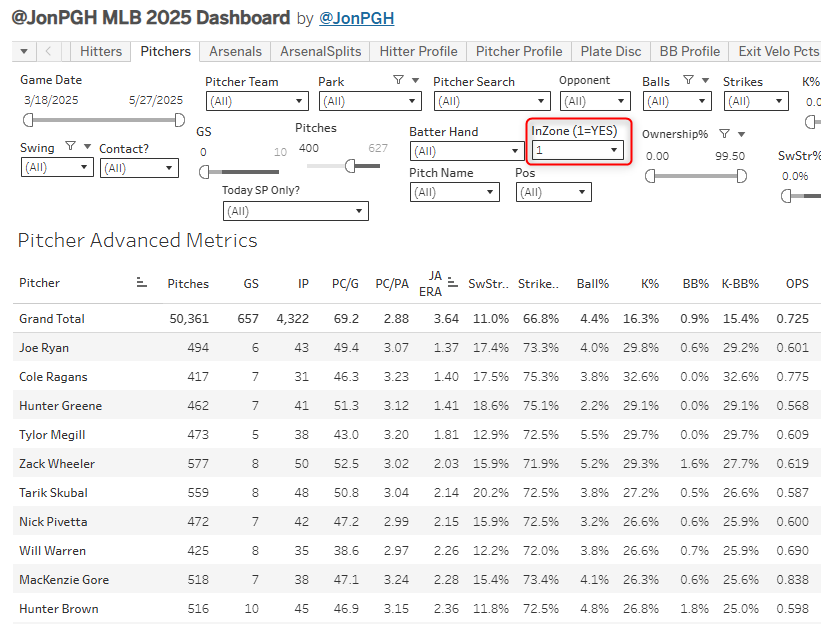
Even crazy stuff like “In Zone” or “Out of Zone”
Want to see how somebody does at home? That’s a little more advanced, but easily doable. Let’s show the Giants for an example. Here’s how you’d do it for SF pitchers at home:

To do road, you want to just exclude the park.

That will put a strikethrough through the park, and then you’ll have the results for any park that isn’t the one you selected.

So yeah, go crazy folks! Hope you enjoy it.
The link to the main dashboard is in the Resource Glossary along with the links to everything else you might need.