Request Player/Topic For Me to Discuss
Watched the first little bit of NBA I have all season last night, and I have to say - I hope it taught you all a lesson about momentum in sports!
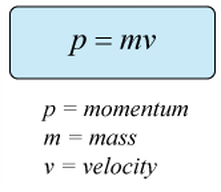
Remember this from grade school?
MOMENTUM is mass times velocity. That has nothing to do with my point about the Celtics. Lots of people thought that the sheer fact that the Celtics had won three in a row made them nearly a lock to win game seven. Of course, the fact that they were clearly a better team in the regular season aided in that too - but there is always a lot of talk about momentum. But it’s funny because if you look back just three games ago, you saw the Celtics break the Heat’s three-game winning streak “momentum”.
I don’t think this concept really exists in sports, at least not nearly to the extent that people think. Games are much more individual events than parts of larger related series, even in basketball. I was rooting for the Heat last night just so I could make this dumb rant that nobody cares about.
Go Nuggets though I love that Jokic guy.
I’ve been relying heavily on the Yesterday SP Data sheet, great resource to check in the mornings after the scripts run!
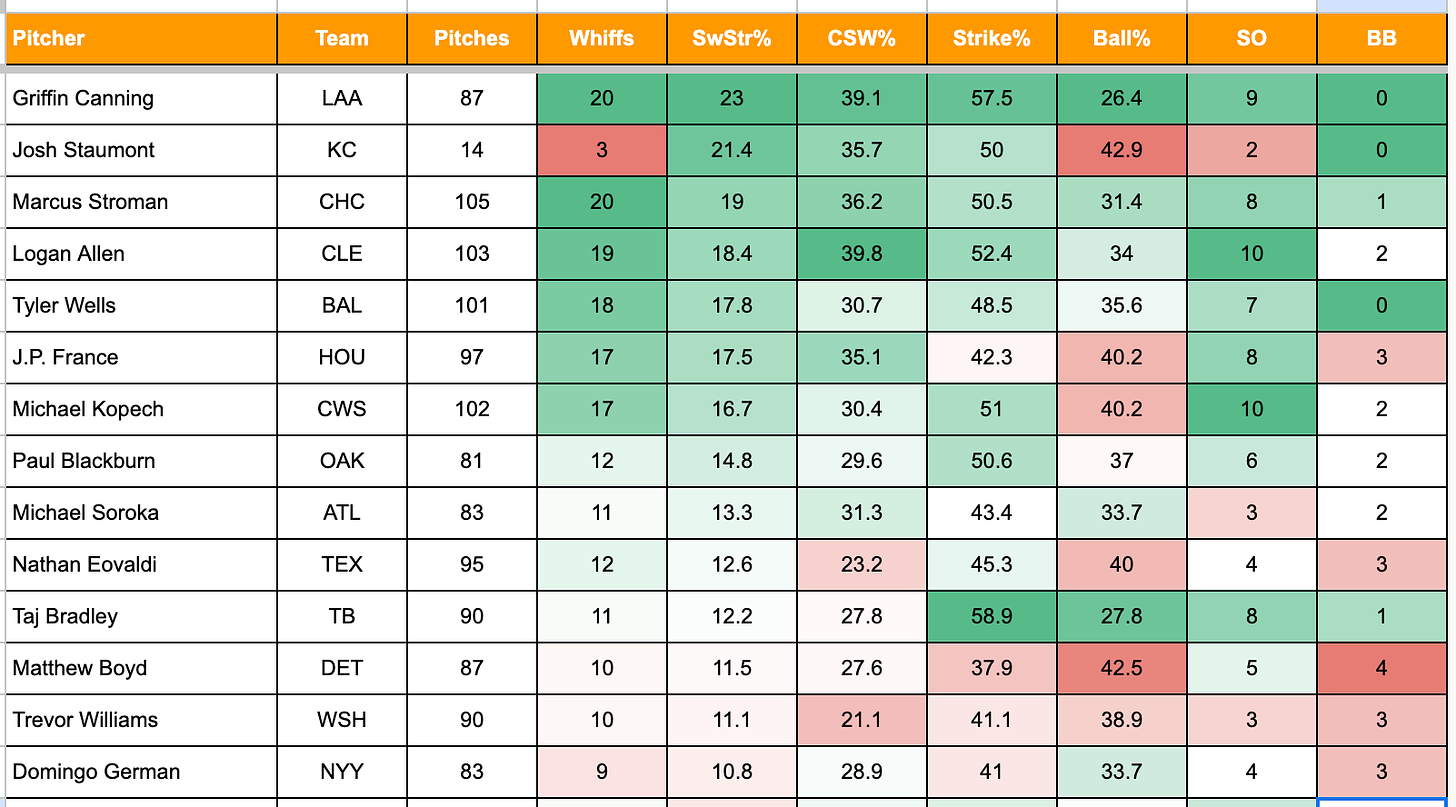
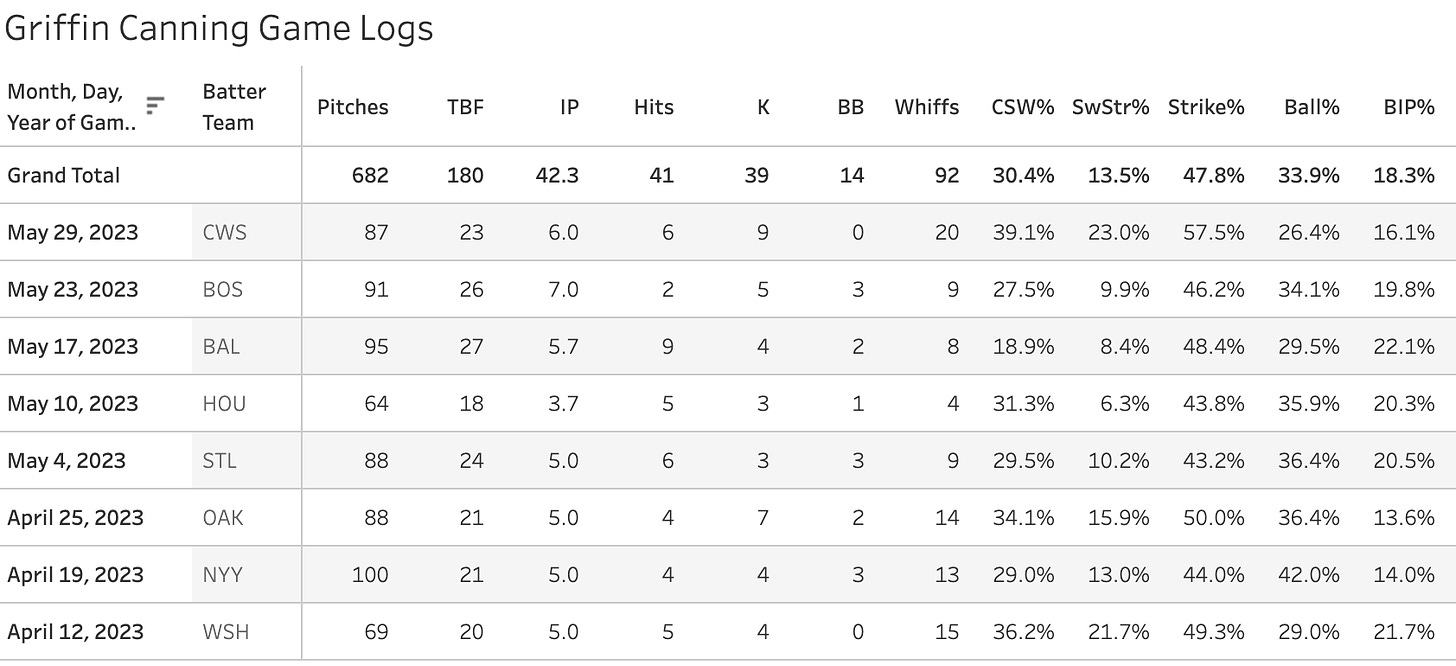
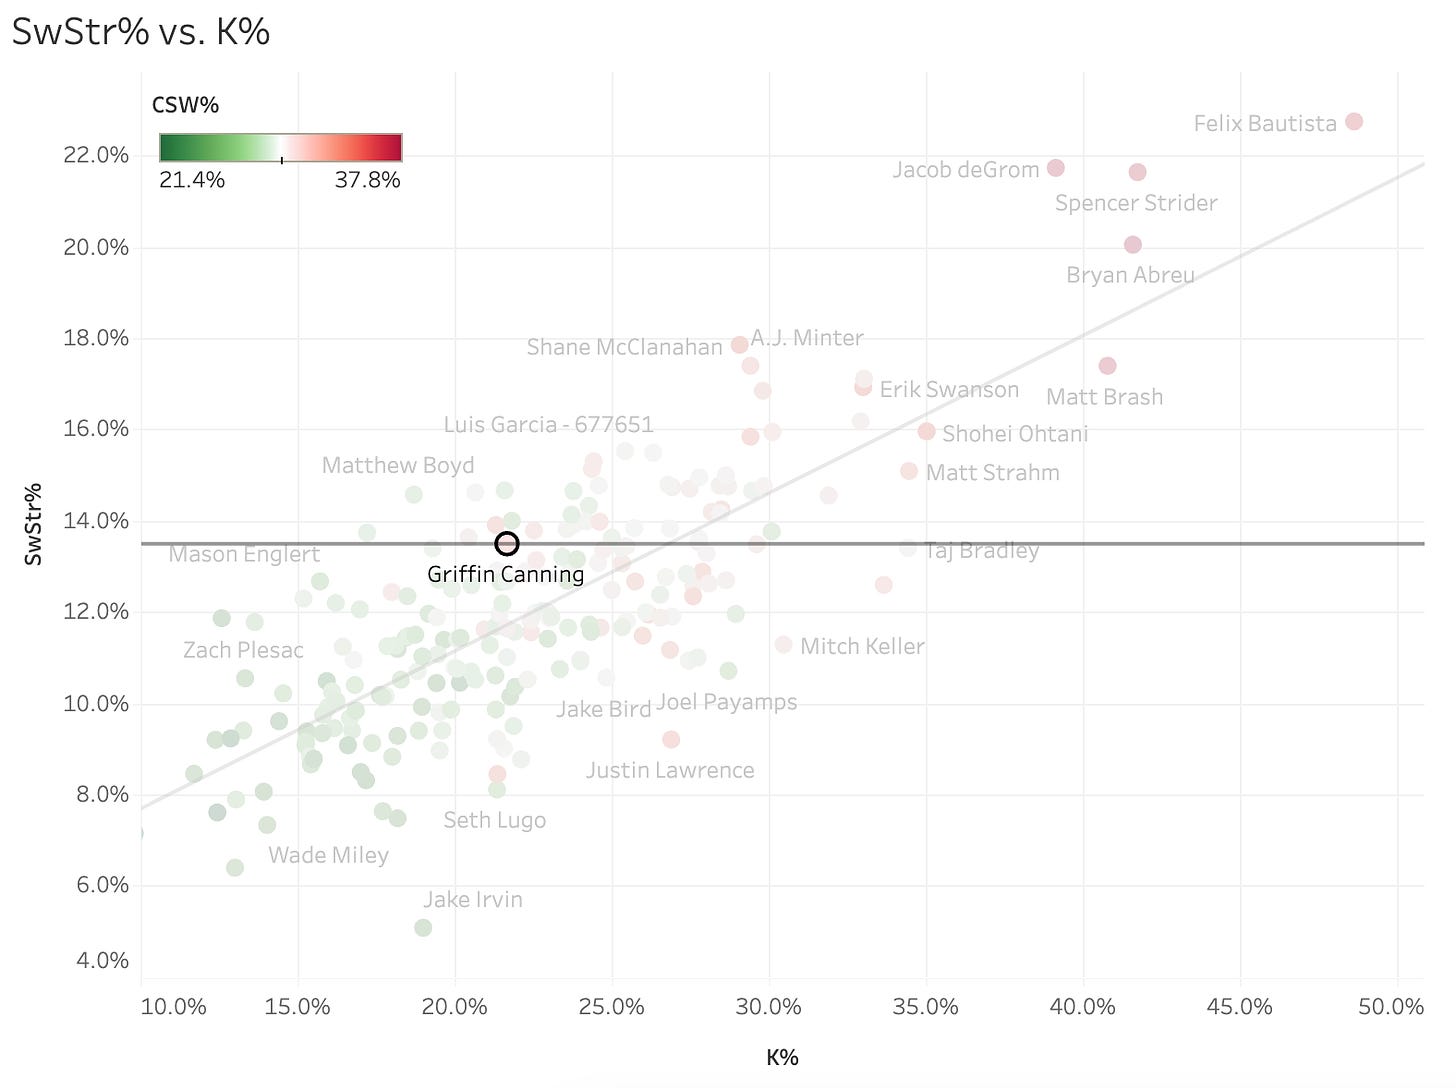
Griffin Canning went nutso, how about that! A 57.5% Strike% with a 23% SwStr%.
I have been talking a ton about SwStr% this year, probably more than anything else - and recently I have brought in Strike% and Ball% to the mix. These stats are meaningless without the proper context, so let’s go over that quickly.
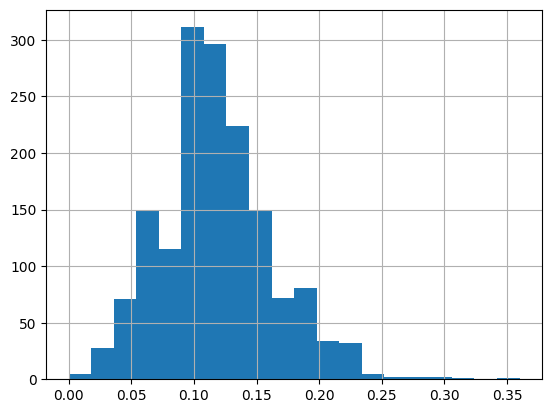
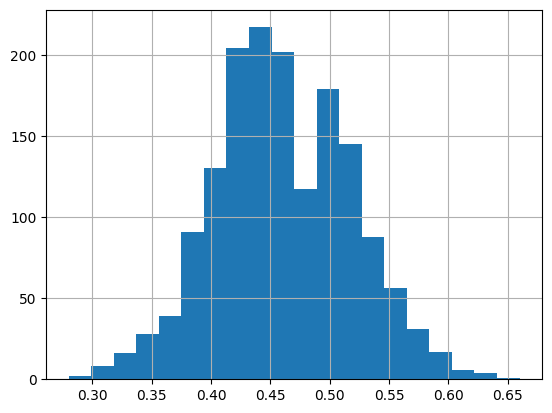
You probably know the league average SwStr% is around 12%. The problem with averages is they only tell you about where the center of the data is. We need to think in terms of distributions. Not all averages are created the same. To get an idea about a distribution, we use the histogram, here is the histogram for SwStr% - using each individual pitcher start in 2023 (with at least 60 pitches thrown), we find each SwStr% output and plot them LIKE THIS:
SP Individual Start SwStr% Distribution
The height of each bar tells you how many times that particular SwStr% range has occurred this year. The highest bars are between 9 and 11%, showing that most starts end up in that range. But I said the league average is 12% - what’s the deal? The lowest you can possibly go is zero - which is 10 points below 10 (MATH!). The highest you can, in theory, go is 100 - which is 90 points above 10. That means the outlier GOOD outings will pull the average up much more than outlier BAD outings, thus that average ending up higher than where the majority of starts end up.
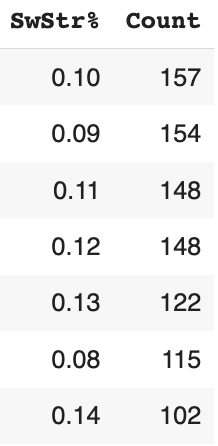
Here are the raw counts for each SwStr% and we’re rounding to two decimal daddies here:
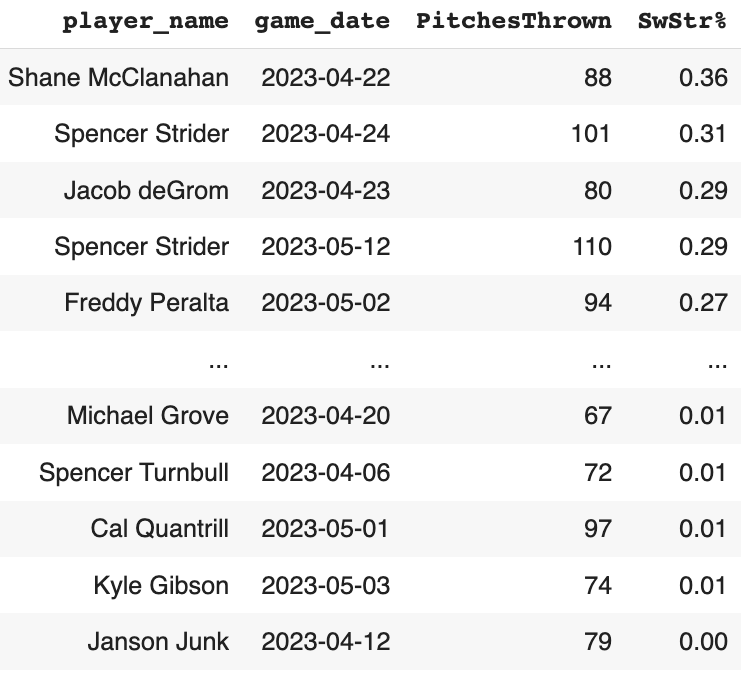
So the most common output is 10%. Here are your top 5 and bottom 5 outliers:
That McClanahan start on 4/22 was a true outlier, as you can see in the histogram above it really stretched the plot out. It’s very, very hard to have that high of a SwStr%.
Anyways, the point here is to show you that a SwStr% above 20% is a pretty rare thing to find - and when you’re getting over 25% you’re really doing something notable.
Okay, now let’s do Strike% and Ball% since these are the “newer” ones that we don’t know quite as much about.
Same methodology here.
Strike%:
For clarity, Strike Rate is what percent of your pitches go for a
called strike
swinging strike
foul ball
So that’s just when the pitch results in a strike being added to the count, or a foul ball on a two-strike count. On any given pitch, earning a strike is probably the most desirable outcome. I mean in reality you would take a pop-up over strike one, since that popup will turn into an out 95%+ of the time and the strike one doesn’t earn an out, but we really do want to find pitchers that earn strikes at a high rate - letting balls get put into play is risky.
The most common outputs, as seen above, are in the 41-45% range. The league average is 46.5%, so again we see the average above the typical range because there’s more room above the average than below it.
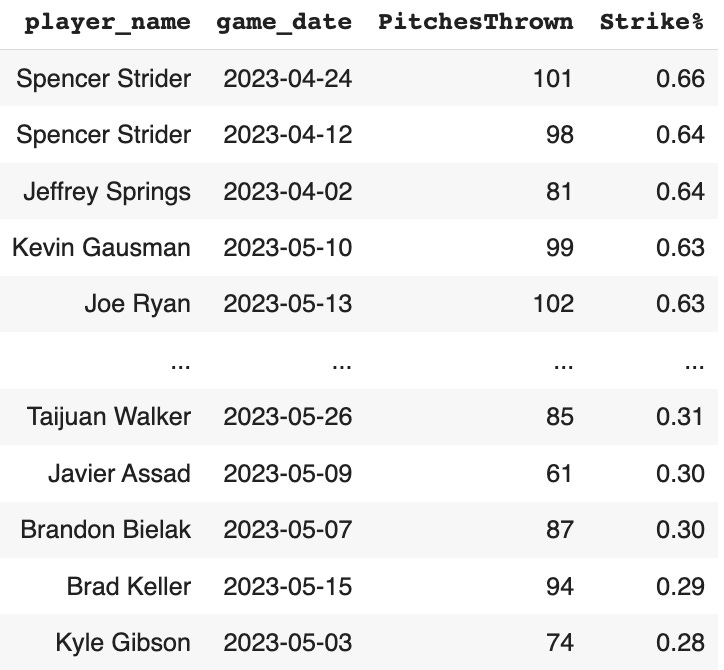
The outliers:
So an outlier outcome would be above 60% and below 35%, I think that’s fair enough to say.
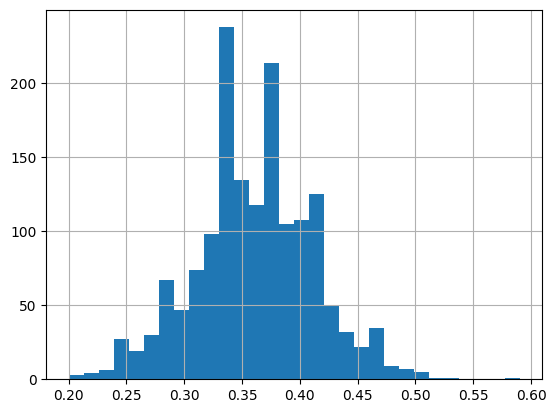
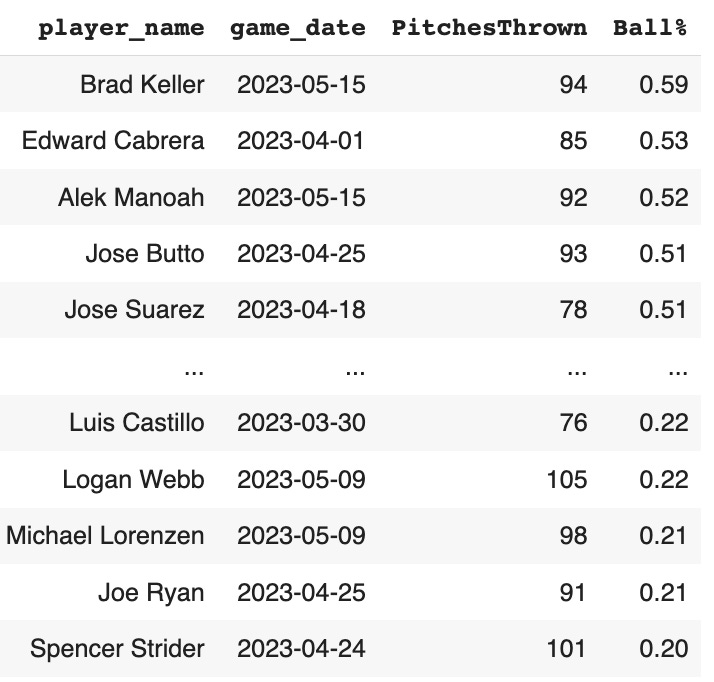
Ball%
The league average here is 36%. The most common outcomes are more spread out between 33% and 38%, and the lowest we’ve seen all year is still above 20%.
You really don’t want to see anything above 42%, and the elite outcomes are below 25%, give or take.
Alright back to the pitchers from yesterday!
We saw that Taj Bradley put up a 58.9% Strike%, which was wayyyy up there. The guy just pounded the strike zone. Here’s how he went about it:
Really nice mix with the two fastball variations and the curveball being used decently evenly. The fastball is a good one and that lets him be confident enough to just throw it where they can hit it and not worry too much about it. Although it’s possible he was actually missing some spots where he wanted to be on the edge but the pitch moved more toward the center - that really wouldn’t necessarily be a good thing, but I can’t say that’s what happened obviously - the one thing we’ll probably never have numbers for is how accurate pitchers are compared to where they wanted to throw the pitch.
Anyways, it’s good to see a guy with this good of stuff throwing a ton of strikes. That’s kind of a good rule to go by - I think. I don’t really want to see a 60% Strike% from like Rich Hill, because he’ll likely get blasted with how poor his pitches are, but for a guy like Bradley with great stuff - yeah that’s good. It will turn into some bad starts like last time when the Blue Jays racked up 9 hits on him, but it will also turn into starts like yesterday where he’s very efficient and collects a really nice WHIP due to lack of walks.
I think Bradley is a must-start from here on out, he’s really been good in the Majors so far:
6 GS, 52% Strike%, 13.4% SwStr%, 34.4% K%, 4.1% BB%, 5.4% Brl%
Maybe some more barrels coming since he’s not a ground-ball pitcher, but maybe not since the stuff is so good in the zone.
The B-Millers went in two opposite directions, and as a Bryce fader and Bobby buyer, I am proud to say it went in favor of the Dodger.
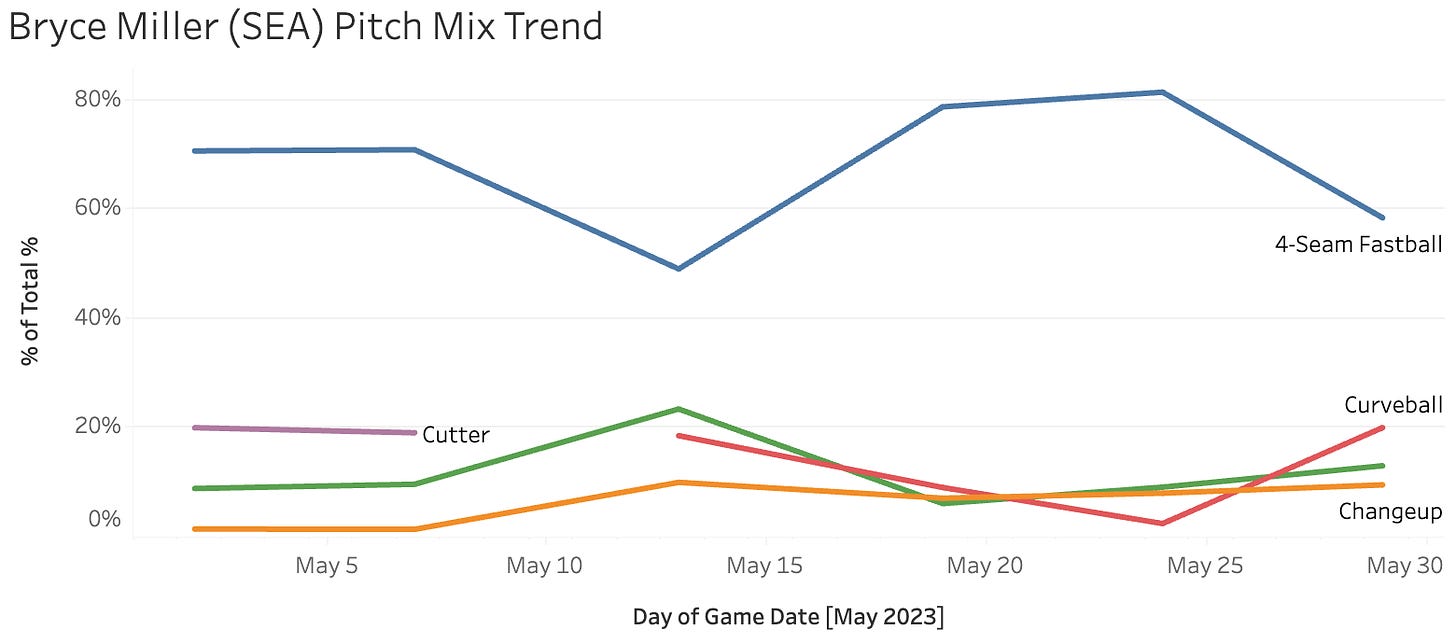
Kind of striking how similar the SwStr% and Strike% stuff was there, but a big split in Ball% and BIP%. Bryce traded some balls for balls in play, and it didn’t work out for him. He lowered the fastball usage from his last two starts:
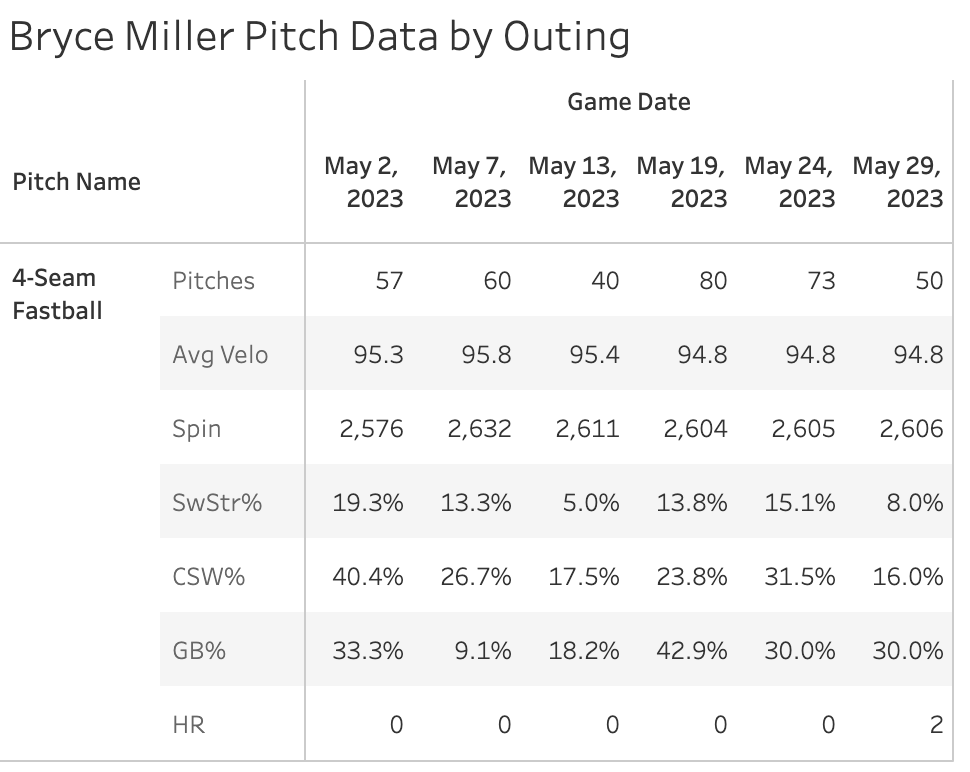
But he gave up two homers on the pitch, his first two of the year on the fastball:
I can’t imagine this dude goes five straight starts with allowing a homer on a fastball as long as he’s using it over 55% of the time. It’s not a super high-velo pitch, and the more time hitters see it and study it the lesser the effect of the release point stuff will be - so I think we’ve seen this guy really overperform early on, but I’m mostly speculating right now. Either way, it’s really tough to throw 300+ four-seam fastballs in the Majors without giving up a homer like he did to start his career.
I suppose you don’t want to sell a guy right after he gave up eight earnies, but I would still be looking to get what I could for the guy in redraft leagues.
As for Bobby, he also had an underwhelming SwStr% and only struck out just four in six innings of work, but only gave up one run on four hits and walked just one batter. He’s now at a 22%-5% K-BB% (9:2 K:BB), but has given up just two runs on eight hits and two walks over 11 innings in the bigs.
The updated pitch mix table:
It’s a really deep pitch mix with three pitches above 20% usage, you don’t see that too often. But you can’t ignore the 9.9% SwStr% right now. The Strike% and Ball% are right there with the league averages, but the bad SwStr% would say that he’s going to be a guy that gives up some runs moving forward - there are just a lot of balls going into play. The GB% of 52% is good but nowhere near the league’s elite, and so far he doesn’t have a pitch that has been really, really tough to put a bat on.
The two results have been good so far, and the depth of the arsenal does give him some leeway with the lower SwStr% - maybe he can reliably generate softer contact consistently since he’s keeping hitters so off balance, but I think these two starts are a pretty big over-performance as well.
I guess I should get back to Griffin Canning. It was his most dominant start fo the year by far with the 9:0 K:BB and the ridiculous 23% SwStr%.
It would be a lot more exciting if he hadn’t ripped off four straight below-average SwStr% rates before that.
He does have an arsenal that I think should be conducive to more strikeouts as he uses the slider and changeup a lot and both pitches have decent SwStr% (the slider is below average for a slider, but you’ll end up getting more total whiffs when you’re throwing a 14% SwStr% 32% of the time like he is).
He now has a 22% K% on a 13.7% SwStr%, which is an underperformance, I would say.
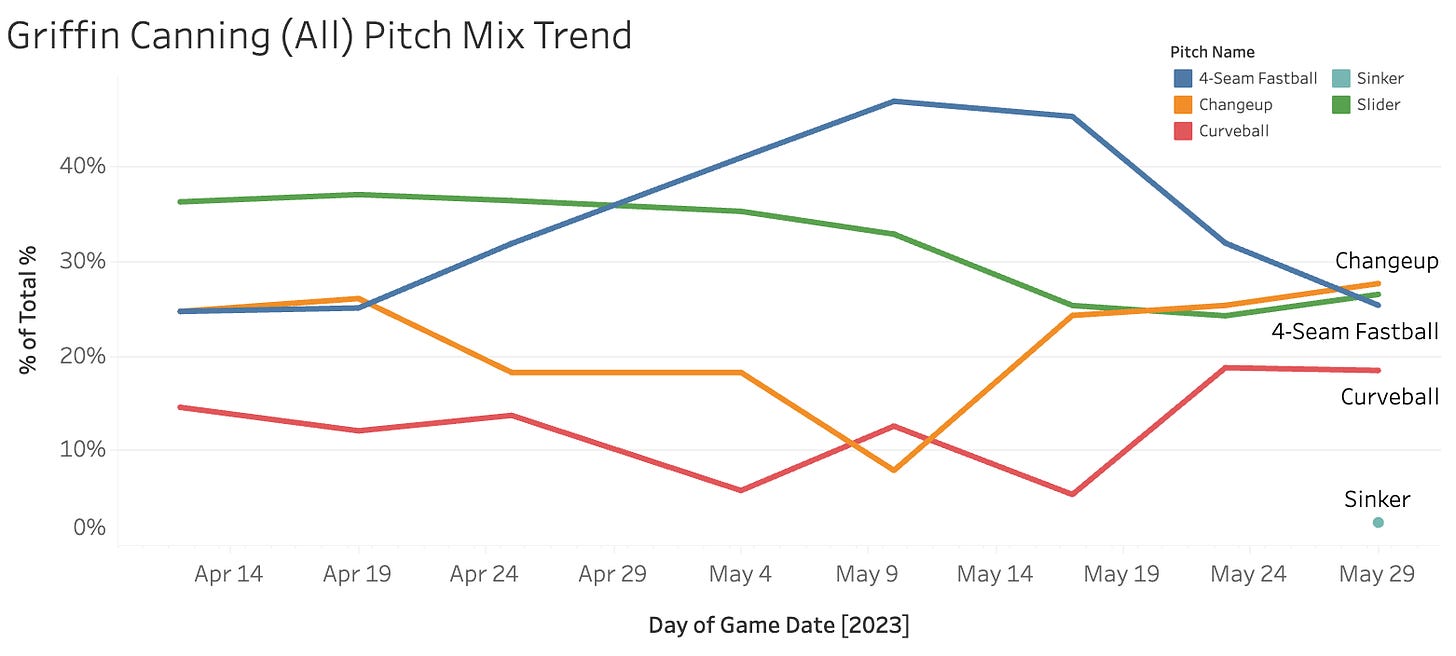
He had that big outing with reduced usage of the four-seam, which isn’t surprising to see:
He brought the changeup and slider up and threw a few more curveballs as well, which is a good recipe for added whiffs. He had a big SwStr% in his first start of the year as well, and you can see the 4-seam usage was lower then too. Seems pretty clear that if he wants to get whiffs, he should evenly distribute the change/slider/four-seam, but there’s always more to it than that.
I would really like to talk to one of these pitchers about that. I know there’s more to the strategy than just “what pitch mix will get the most whiffs”, but I’d like to hear about all the stuff they consider. Do they not want to throw too many breaking balls for the sake of their elbows? Or just overall efficiency since those breakers are harder to throw for strikes? Or do they not want to show the breakers too much because that will reduce their effectiveness? All very interesting questions and I’m sure I’d learn a lot talking to one of these dudes. So if you know Griffin Canning or another Major Leaguer - give me a shout (lol).
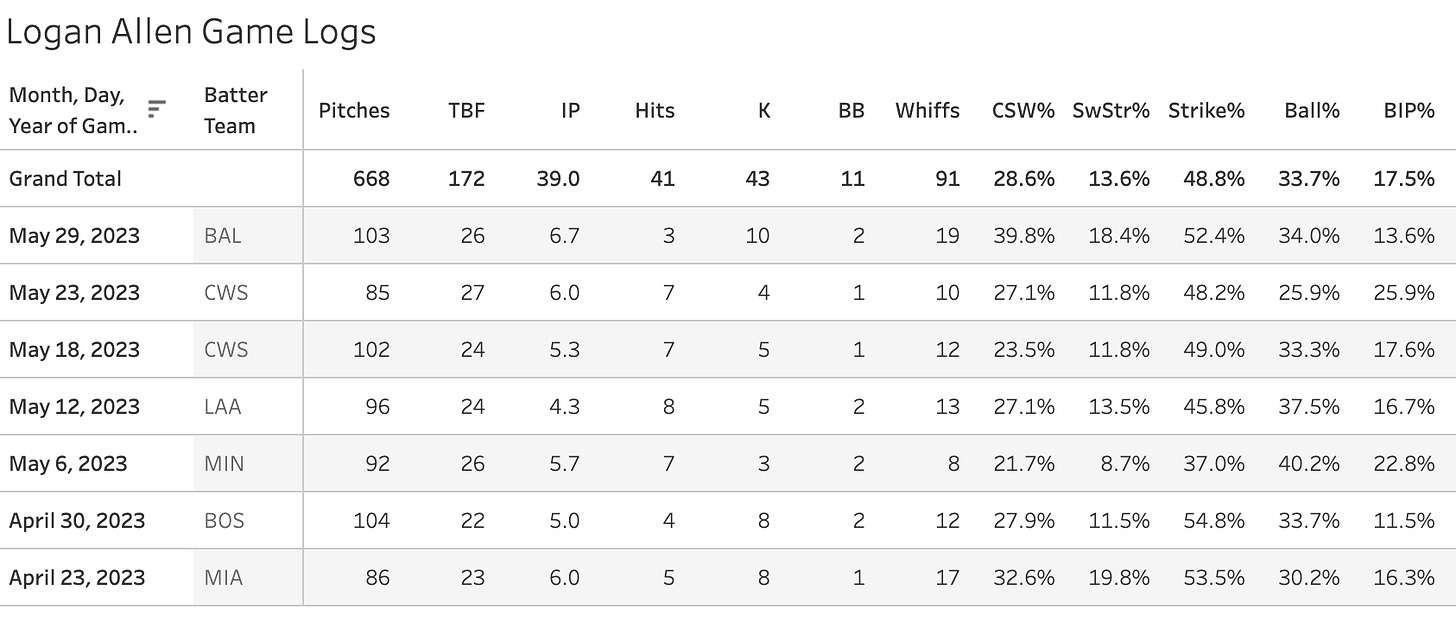
Logan Allen was quite excellent yesterday against the Orioles.
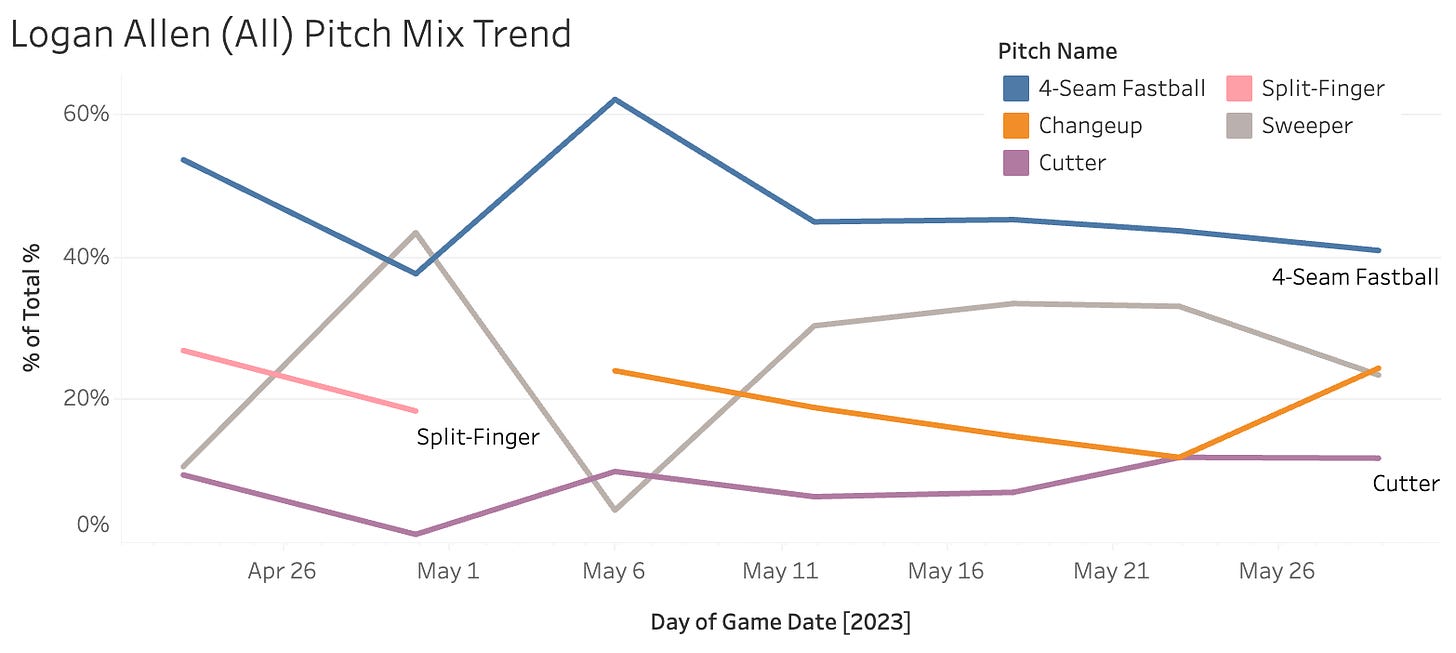
Game-high, season-high, career-high 10 strikeouts and 19 whiffs against a team that isn’t easy to whiff. No huge changes in the pitch mix, but he did raise the changeup usage a bit and kept the four-seamer in the low-forties like he has been:
The arsenal table for the year:
It’s a lot of two pitches, going above 70% usage with the fastball and sweeper. He is a lefty, which maybe helps the deception. The four-seamer at a 9.7% SwStr% isn’t a standout number, but it’s fine since four-seamers only average a 10.5% SwStr%.
The sweep-daddy and change are quite good, so this guy has more than enough to be a believably good SP right now. He’s a top 40 or 50 SP moving forward, I would say.
Jack Suwinski hit two balls into the San Francisco Bay or whatever tf it’s called.
He’s a cluster scorer this year. He has four homers in his last four games, but between April 30th and May 25th, he hit just one homer in 75 PA with a 36% K%. I still think he’ll end up with a good amount of homers when all is said and done, but the strikeout problem is back and that makes him a very unreliable week-to-week player.
That’ll be all the time I have for today, thanks for reading!
1. Marcus Stroman (vs. TB): 39.05 Points
2. Logan Allen - 671106 (vs. BAL): 36.75 Points
3. Taj Bradley (vs. CHC): 26.36 Points
4. Griffin Canning (vs. CWS): 25.9 Points
5. Tyler Wells (vs. CLE): 23.1 Points
6. Mike Mayers (vs. STL): 22.3 Points
7. Bobby Miller (vs. WSH): 20.5 Points
8. Nathan Eovaldi (vs. DET): 19.05 Points
9. Lucas Erceg (vs. ATL): 18.75 Points
10. Michael Kopech (vs. LAA): 17.54 Points
1. Griffin Canning (LAA): 20 Whiffs (87 Pitches)
2. Marcus Stroman (CHC): 20 Whiffs (105 Pitches)
3. Logan Allen (CLE): 19 Whiffs (103 Pitches)
4. Tyler Wells (BAL): 18 Whiffs (101 Pitches)
5. J.P. France (HOU): 17 Whiffs (97 Pitches)
6. Michael Kopech (CWS): 17 Whiffs (102 Pitches)
7. Drey Jameson (ARI): 15 Whiffs (59 Pitches)
8. Paul Blackburn (OAK): 12 Whiffs (81 Pitches)
9. Nathan Eovaldi (TEX): 12 Whiffs (95 Pitches)
10. Michael Soroka (ATL): 11 Whiffs (83 Pitches)
1. Steven Matz (STL): 60.0 Strike%, 28.0 Ball%
2. Taj Bradley (TB): 58.9 Strike%, 27.8 Ball%
3. Drey Jameson (ARI): 57.6 Strike%, 25.4 Ball%
4. Griffin Canning (LAA): 57.5 Strike%, 26.4 Ball%
5. Logan Allen (CLE): 52.4 Strike%, 34.0 Ball%
6. Michael Kopech (CWS): 51.0 Strike%, 40.2 Ball%
7. Paul Blackburn (OAK): 50.6 Strike%, 37.0 Ball%
8. Marcus Stroman (CHC): 50.5 Strike%, 31.4 Ball%
9. Tyler Wells (BAL): 48.5 Strike%, 35.6 Ball%
10. Adam Wainwright (STL): 46.7 Strike%, 36.2 Ball%
11. Nathan Eovaldi (TEX): 45.3 Strike%, 40.0 Ball%
12. Michael Soroka (ATL): 43.4 Strike%, 33.7 Ball%
13. Mike Mayers (KC): 43.4 Strike%, 34.2 Ball%
14. Bryce Miller (SEA): 43.0 Strike%, 32.6 Ball%
15. Bobby Miller (LAD): 42.5 Strike%, 37.9 Ball%
1. Marcus Stroman - 9.0 IP - 209.5 JA Points
2. Logan Allen - 6.67 IP - 184.5 JA Points
3. Tyler Wells - 6.0 IP - 164.0 JA Points
4. Griffin Canning - 6.0 IP - 144.0 JA Points
5. Michael Soroka - 6.0 IP - 126.5 JA Points
6. J.P. France - 6.0 IP - 125.0 JA Points
7. Taj Bradley - 5.67 IP - 116.5 JA Points
8. Drey Jameson - 3.67 IP - 113.5 JA Points
9. Mike Mayers - 6.0 IP - 109.5 JA Points
10. Bobby Miller - 5.67 IP - 107.0 JA Points
1. Jacob deGrom (TEX) - 6.0 GS - 125.08 JA Points
2. Spencer Strider (ATL) - 11.0 GS - 122.5 JA Points
3. Nick Lodolo (CIN) - 7.0 GS - 119.12 JA Points
4. Brayan Bello (BOS) - 7.0 GS - 112.43 JA Points
5. David Peterson (NYM) - 8.0 GS - 109.05 JA Points
6. Shane McClanahan (TB) - 11.0 GS - 108.87 JA Points
7. Clayton Kershaw (LAD) - 11.0 GS - 107.82 JA Points
8. Shohei Ohtani (LAA) - 11.0 GS - 107.71 JA Points
9. Jesus Luzardo (MIA) - 11.0 GS - 106.79 JA Points
10. Hunter Greene (CIN) - 11.0 GS - 106.4 JA Points
Matthew Boyd's SI velo (16 pitches) UP 2.4mph to 92.1
Matthew Boyd's SL velo (31 pitches) UP 2.2mph to 81.4
Nathan Eovaldi's CU velo (13 pitches) DOWN -1.5mph to 75.3
Bryce Miller's CU velo (17 pitches) DOWN -1.6mph to 79.8
Anthony DeSclafani's CH velo (15 pitches) DOWN -1.7mph to 85.0
J.P. France's CH velo (30 pitches) DOWN -1.9mph to 81.7
Anthony DeSclafani's CH usage (20.3%) up 10.6 points
Bobby Miller's SI usage (31.0%) up 23.6 points
Bryce Miller's CU usage (19.8%) up 13.4 points
Drey Jameson's SL usage (47.5%) up 20.3 points
J.P. France's CH usage (30.9%) up 23.7 points
Karl Kauffmann's SI usage (40.8%) up 10.9 points
Logan Allen's CH usage (24.3%) up 11.9 points
Matthew Boyd's SI usage (18.4%) up 13.5 points
Mike Mayers's FF usage (42.1%) up 14.3 points
Nathan Eovaldi's FF usage (51.6%) up 13.8 points
Ryne Nelson's SL usage (31.0%) up 17.7 points
Braxton Garrett Cutter: +25.5%
Graham Ashcraft Cutter: +22.4%
Graham Ashcraft Sinker: -20.0%
Hunter Gaddis Cutter: -18.8%
Noah Syndergaard Curveball: +16.6%
Shohei Ohtani Sweeper: -16.1%
Hunter Brown 4-Seam Fastball: +15.7%
James Kaprielian Sinker: -15.1%
Yusei Kikuchi Curveball: +14.5%
Kyle Freeland Slider: -14.5%
Jordan Lyles 4-Seam Fastball: -14.5%
James Kaprielian Slider: +14.2%
Luke Weaver Cutter: +14.0%
Dean Kremer Cutter: +13.9%
Cal Quantrill Sinker: -13.2%
Braxton Garrett 4-Seam Fastball: -12.9%
Zack Greinke Curveball: -12.9%
Louie Varland 4-Seam Fastball: +12.9%
Jameson Taillon Sinker: +12.7%
Jack Flaherty Slider: -12.6%
Yusei Kikuchi Slider: -12.5%
Hunter Brown Slider: -12.4%
Spencer Strider - 96 TBF, 36.6% CSW%
Hunter Brown - 73 TBF, 35.7% CSW%
Charlie Morton - 102 TBF, 35.2% CSW%
Shohei Ohtani - 104 TBF, 35.2% CSW%
Logan Webb - 105 TBF, 33.4% CSW%
Luis Castillo - 94 TBF, 33.4% CSW%
Logan Gilbert - 74 TBF, 33.3% CSW%
Clayton Kershaw - 86 TBF, 33.3% CSW%
Alex Wood - 69 TBF, 33.0% CSW%
Shane McClanahan - 73 TBF, 32.8% CSW%
Spencer Strider - 96 TBF, 40.6% K%
Mitch Keller - 76 TBF, 38.2% K%
Michael Kopech - 92 TBF, 37.0% K%
Hunter Brown - 73 TBF, 37.0% K%
Hunter Greene - 93 TBF, 35.5% K%
Luis Castillo - 94 TBF, 35.1% K%
Kodai Senga - 72 TBF, 34.7% K%
Tyler Wells - 91 TBF, 33.0% K%
Joe Ryan - 73 TBF, 31.5% K%
Clayton Kershaw - 86 TBF, 31.4% K%
Mitch Keller - 76 TBF, 35.5% K-BB%
Hunter Brown - 73 TBF, 34.2% K-BB%
Spencer Strider - 96 TBF, 33.3% K-BB%
Luis Castillo - 94 TBF, 28.7% K-BB%
Tyler Wells - 91 TBF, 27.5% K-BB%
Michael Kopech - 92 TBF, 27.2% K-BB%
Joe Ryan - 73 TBF, 26.0% K-BB%
Hunter Greene - 93 TBF, 25.8% K-BB%
Framber Valdez - 105 TBF, 25.7% K-BB%
Chris Sale - 72 TBF, 25.0% K-BB%
Logan Webb - 105 TBF, 66.7% GB%
Marcus Stroman - 97 TBF, 63.4% GB%
Brayan Bello - 75 TBF, 62.0% GB%
Josh Fleming - 86 TBF, 59.7% GB%
Hunter Brown - 73 TBF, 59.1% GB%
Alex Cobb - 99 TBF, 58.2% GB%
Alex Wood - 69 TBF, 57.4% GB%
Shohei Ohtani - 104 TBF, 57.4% GB%
Andrew Heaney - 99 TBF, 53.7% GB%
Nathan Eovaldi - 108 TBF, 53.3% GB%
Aaron Judge (NYY) 5 PA, 8 Swings, 2 Barrels, 2 HR
Austin Slater (SF) 6 PA, 8 Swings, 2 Barrels, 1 HR
Jack Suwinski (PIT) 4 PA, 5 Swings, 2 Barrels, 2 HR
Jose Altuve (HOU) 5 PA, 6 Swings, 2 Barrels, 1 HR
Michael Massey (KC) 5 PA, 12 Swings, 2 Barrels, 1 HR
C.J. Abrams, Yesterday: 112.5 Previous High: 109.6
Michael Harris II, Yesterday: 113.9 Previous High: 113.6
Ryan Jeffers, Yesterday: 117.4 Previous High: 115.2
1. Austin Slater - 6.0 PA - 70.0 JA Points
2. Aaron Judge - 5.0 PA - 40.0 JA Points
3. Michael Massey - 5.0 PA - 36.0 JA Points
4. Patrick Bailey - 5.0 PA - 35.0 JA Points
5. Jack Suwinski - 4.0 PA - 35.0 JA Points
6. Corey Seager - 5.0 PA - 28.5 JA Points
7. Mauricio Dubon - 4.0 PA - 27.0 JA Points
8. Jake Bauers - 5.0 PA - 26.0 JA Points
9. Jose Abreu - 4.0 PA - 23.5 JA Points
10. Ryan McMahon - 5.0 PA - 22.5 JA Points
1. Freddie Freeman (LAD) - 247.0 PA - 14.57 JA Points
2. Bo Bichette (TOR) - 245.0 PA - 12.33 JA Points
3. Aaron Judge (NYY) - 193.0 PA - 10.67 JA Points
4. Ronald Acuna Jr. (ATL) - 243.0 PA - 7.41 JA Points
5. Bryan Reynolds (PIT) - 220.0 PA - 6.27 JA Points
6. Yandy Diaz (TB) - 199.0 PA - 4.62 JA Points
7. Yordan Alvarez (HOU) - 202.0 PA - -7.92 JA Points
8. Vladimir Guerrero Jr. (TOR) - 225.0 PA - -11.11 JA Points
9. Kyle Tucker (HOU) - 214.0 PA - -13.55 JA Points
10. Pete Alonso (NYM) - 227.0 PA - -13.83 JA Points
Ryan Jeffers (MIN) - 117.4mph - home_run
Aaron Judge (NYY) - 116.9mph - home_run
Ronald Acuna Jr. (ATL) - 115.9mph - field_out
Michael Harris II (ATL) - 113.9mph - field_out
C.J. Abrams (WSH) - 112.5mph - single
Julio Rodriguez (SEA) - 112.0mph - home_run
Matt Olson (ATL) - 111.7mph - home_run
Ryan McMahon (COL) - 111.5mph - home_run
Julio Rodriguez (SEA) - 111.1mph - nan
Brenton Doyle (COL) - 110.9mph - single
#####Top 10
Andy Ibanez - 59 PA, 0.112 wOBA, 0.279 xwOBA, 0.167 Diff
Keibert Ruiz - 55 PA, 0.235 wOBA, 0.362 xwOBA, 0.127 Diff
Miguel Rojas - 56 PA, 0.272 wOBA, 0.381 xwOBA, 0.109 Diff
Willson Contreras - 77 PA, 0.241 wOBA, 0.35 xwOBA, 0.109 Diff
Jorge Mateo - 58 PA, 0.114 wOBA, 0.221 xwOBA, 0.107 Diff
Kris Bryant - 68 PA, 0.21 wOBA, 0.309 xwOBA, 0.099 Diff
Daulton Varsho - 76 PA, 0.219 wOBA, 0.315 xwOBA, 0.096 Diff
Willy Adames - 63 PA, 0.209 wOBA, 0.288 xwOBA, 0.079 Diff
Brendan Donovan - 69 PA, 0.314 wOBA, 0.391 xwOBA, 0.077 Diff
Taylor Ward - 55 PA, 0.151 wOBA, 0.227 xwOBA, 0.076 Diff
Bottom 10
Isaac Paredes - 62 PA, 0.432 wOBA, 0.269 xwOBA, -0.163 Diff
Owen Miller - 65 PA, 0.462 wOBA, 0.345 xwOBA, -0.117 Diff
Matt McLain - 57 PA, 0.456 wOBA, 0.342 xwOBA, -0.114 Diff
Francisco Alvarez - 60 PA, 0.485 wOBA, 0.373 xwOBA, -0.112 Diff
Joey Meneses - 73 PA, 0.367 wOBA, 0.271 xwOBA, -0.096 Diff
Charlie Blackmon - 65 PA, 0.414 wOBA, 0.323 xwOBA, -0.091 Diff
Stuart Fairchild - 56 PA, 0.351 wOBA, 0.26 xwOBA, -0.091 Diff
Dominic Fletcher - 57 PA, 0.332 wOBA, 0.242 xwOBA, -0.09 Diff
Anthony Rizzo - 78 PA, 0.399 wOBA, 0.309 xwOBA, -0.09 Diff
Seiya Suzuki - 72 PA, 0.462 wOBA, 0.375 xwOBA, -0.087 Diff
Aaron Judge - 86 PA, 49 BIP, 19 Brls, 38.8 Brl%
Matt Olson - 83 PA, 51 BIP, 15 Brls, 29.4 Brl%
Yordan Alvarez - 77 PA, 51 BIP, 14 Brls, 27.5 Brl%
Patrick Wisdom - 46 PA, 22 BIP, 6 Brls, 27.3 Brl%
Ryan Noda - 65 PA, 30 BIP, 8 Brls, 26.7 Brl%
Pete Alonso - 79 PA, 55 BIP, 13 Brls, 23.6 Brl%
Brenton Doyle - 46 PA, 26 BIP, 6 Brls, 23.1 Brl%
Dansby Swanson - 79 PA, 58 BIP, 13 Brls, 22.4 Brl%
Christopher Morel - 70 PA, 41 BIP, 9 Brls, 22.0 Brl%
Kyle Schwarber - 75 PA, 34 BIP, 7 Brls, 20.6 Brl%
Aaron Judge - 86 PA, 0.559 xwOBA
Yordan Alvarez - 77 PA, 0.522 xwOBA
Juan Soto - 74 PA, 0.488 xwOBA
Freddie Freeman - 87 PA, 0.464 xwOBA
Pete Alonso - 79 PA, 0.46 xwOBA
Matt Olson - 83 PA, 0.445 xwOBA
Dansby Swanson - 79 PA, 0.436 xwOBA
Riley Greene - 79 PA, 0.436 xwOBA
Mookie Betts - 85 PA, 0.436 xwOBA
Ronald Acuna Jr. - 85 PA, 0.435 xwOBA
Luis Arraez - 69 PA, 132 Swings, 93.2 Cont%
Brendan Donovan - 69 PA, 113 Swings, 92.0 Cont%
Wander Franco - 88 PA, 142 Swings, 90.1 Cont%
Adley Rutschman - 76 PA, 117 Swings, 88.9 Cont%
Steven Kwan - 78 PA, 115 Swings, 88.7 Cont%
Nico Hoerner - 45 PA, 93 Swings, 88.2 Cont%
Willie Calhoun - 48 PA, 63 Swings, 87.3 Cont%
Alex Bregman - 78 PA, 116 Swings, 87.1 Cont%
Vinnie Pasquantino - 79 PA, 138 Swings, 86.2 Cont%
Jeff McNeil - 72 PA, 130 Swings, 86.2 Cont%
Wander Franco - 6 Attempts (5 steals)
Esteury Ruiz - 6 Attempts (6 steals)
Harrison Bader - 5 Attempts (4 steals)
Zach McKinstry - 5 Attempts (5 steals)
Taylor Walls - 5 Attempts (5 steals)
Ronald Acuna Jr. - 5 Attempts (4 steals)
Josh Lowe - 4 Attempts (4 steals)
Willi Castro - 4 Attempts (4 steals)
Corbin Carroll - 4 Attempts (4 steals)
Jose Caballero - 4 Attempts (3 steals)
Luke Raley - 4 Attempts (4 steals)
Bobby Witt Jr. - 4 Attempts (3 steals)
Esteury Ruiz - 19 Attempts (16 steals)
Wander Franco - 15 Attempts (13 steals)
Bobby Witt Jr. - 11 Attempts (9 steals)
Taylor Walls - 11 Attempts (11 steals)
Ronald Acuna Jr. - 10 Attempts (9 steals)
Whit Merrifield - 10 Attempts (10 steals)
Josh Lowe - 10 Attempts (8 steals)
Willi Castro - 10 Attempts (9 steals)
Ji Hwan Bae - 9 Attempts (5 steals)
Harrison Bader - 8 Attempts (6 steals)
Thairo Estrada - 8 Attempts (5 steals)
Luke Raley - 7 Attempts (7 steals)
Jon Berti - 7 Attempts (3 steals)
Austin Riley - +3.9% Contact%, +6.3 mph exit velo, -10.4 Chase%
Adley Rutschman - +7.6% Contact%, +3.7 mph exit velo, -6.6 Chase%
Daulton Varsho - +7.7% Contact%, +3.7 mph exit velo, -14.7 Chase%
Brendan Donovan - +10.6% Contact%, +3.0 mph exit velo, -11.4 Chase%
Josh Jung - +4.3% Contact%, +5.4 mph exit velo, -6.7 Chase%
C.J. Abrams - +4.0% Contact%, +3.8 mph exit velo, -6.2 Chase%
Randy Arozarena - +11.8% Contact%, +3.0 mph exit velo, -4.2 Chase%
Willie Calhoun - +8.9% Contact%, +4.1 mph exit velo, -10.0 Chase%
Jeremy Pena - +3.7% Contact%, +3.9 mph exit velo, -11.3 Chase%
George Springer - 0.399 xwOBA, 10.6% Brl%, 78.8% Contact%, 21.1% Chase%, 9.8% K%
Juan Soto - 0.472 xwOBA, 12.0% Brl%, 76.9% Contact%, 12.7% Chase%, 20.4% K%
Lars Nootbaar - 0.379 xwOBA, 15.6% Brl%, 81.0% Contact%, 18.0% Chase%, 21.2% K%
Mookie Betts - 0.385 xwOBA, 11.9% Brl%, 78.5% Contact%, 13.2% Chase%, 17.5% K%
Pete Alonso - 0.493 xwOBA, 24.4% Brl%, 81.6% Contact%, 23.9% Chase%, 10.5% K%
Ronald Acuna Jr. - 0.425 xwOBA, 16.7% Brl%, 83.5% Contact%, 25.0% Chase%, 16.1% K%
James Outman - 45.7% Whiff%, 81.0% Weak%, 0.991 Cold Rating
Bryce Harper - 43.9% Whiff%, 75.0% Weak%, 0.961 Cold Rating
Shea Langeliers - 40.0% Whiff%, 76.9% Weak%, 0.957 Cold Rating
Shohei Ohtani - 38.9% Whiff%, 72.7% Weak%, 0.922 Cold Rating
J.T. Realmuto - 31.4% Whiff%, 75.0% Weak%, 0.868 Cold Rating
Javier Baez - 33.3% Whiff%, 70.0% Weak%, 0.851 Cold Rating
Blake Sabol - 33.3% Whiff%, 69.6% Weak%, 0.848 Cold Rating
Christian Walker - 28.9% Whiff%, 80.0% Weak%, 0.84 Cold Rating
Brent Rooker - 43.6% Whiff%, 65.4% Weak%, 0.839 Cold Rating
Jace Peterson - 29.3% Whiff%, 76.0% Weak%, 0.837 Cold Rating
Luis Torrens (WSH): 4/5, 1R, 1HR, 3RBI, 0SB, 27FPts
Nick Dini (TB): 2/5, 3R, 1HR, 2RBI, 0SB, 27FPts
Travis Blankenhorn (WSH): 2/4, 3R, 1HR, 3RBI, 0SB, 27FPts
Matt Adams (WSH): 2/4, 3R, 1HR, 2RBI, 0SB, 27FPts
Michael Papierski (DET): 3/4, 2R, 1HR, 3RBI, 0SB, 26FPts
Parker Meadows (DET): 2/4, 2R, 1HR, 1RBI, 0SB, 24FPts
Owen Caissie (CHC): 1/3, 3R, 1HR, 1RBI, 0SB, 22FPts
Kyle Manzardo (TB): 4/6, 1R, 0HR, 2RBI, 0SB, 22FPts
Chase Strumpf (CHC): 2/4, 1R, 0HR, 4RBI, 0SB, 20FPts
Nick Gonzales (PIT): 2/5, 2R, 0HR, 2RBI, 0SB, 20FPts
Kohl Franklin (CHC): 5IP, 1H, 0ER, 5K, 2BB, 23FPts
Kent Emanuel (PIT): 5IP, 3H, 1ER, 5K, 1BB, 20FPts
Jose Lopez (TB): 2IP, 0H, 0ER, 4K, 0BB, 18FPts
Gerson Moreno (WSH): 2IP, 1H, 0ER, 2K, 2BB, 10FPts
Michael Byrne (CIN): 1IP, 2H, 0ER, 4K, 0BB, 10FPts
Anthony Banda (WSH): 3IP, 0H, 0ER, 2K, 2BB, 9FPts
Tommy Romero (WSH): 3IP, 2H, 1ER, 3K, 3BB, 8FPts
Hunter Parsons (NYM): 2IP, 1H, 0ER, 2K, 0BB, 7FPts
Jacob Lopez (TB): 3IP, 4H, 2ER, 4K, 2BB, 7FPts
Luke Little (CHC): 1IP, 2H, 0ER, 3K, 1BB, 7FPts
All of the really good stuff in the notes has been moved behind the paywall. For $7/month or $70/year, you will receive more detailed notes along with custom reports, dashboards, projections, and a ton more. 10% of your membership fees go directly to Samaritan’s Purse Charity.
Free samples


